1
フォロー
1750
フォロワー
概要
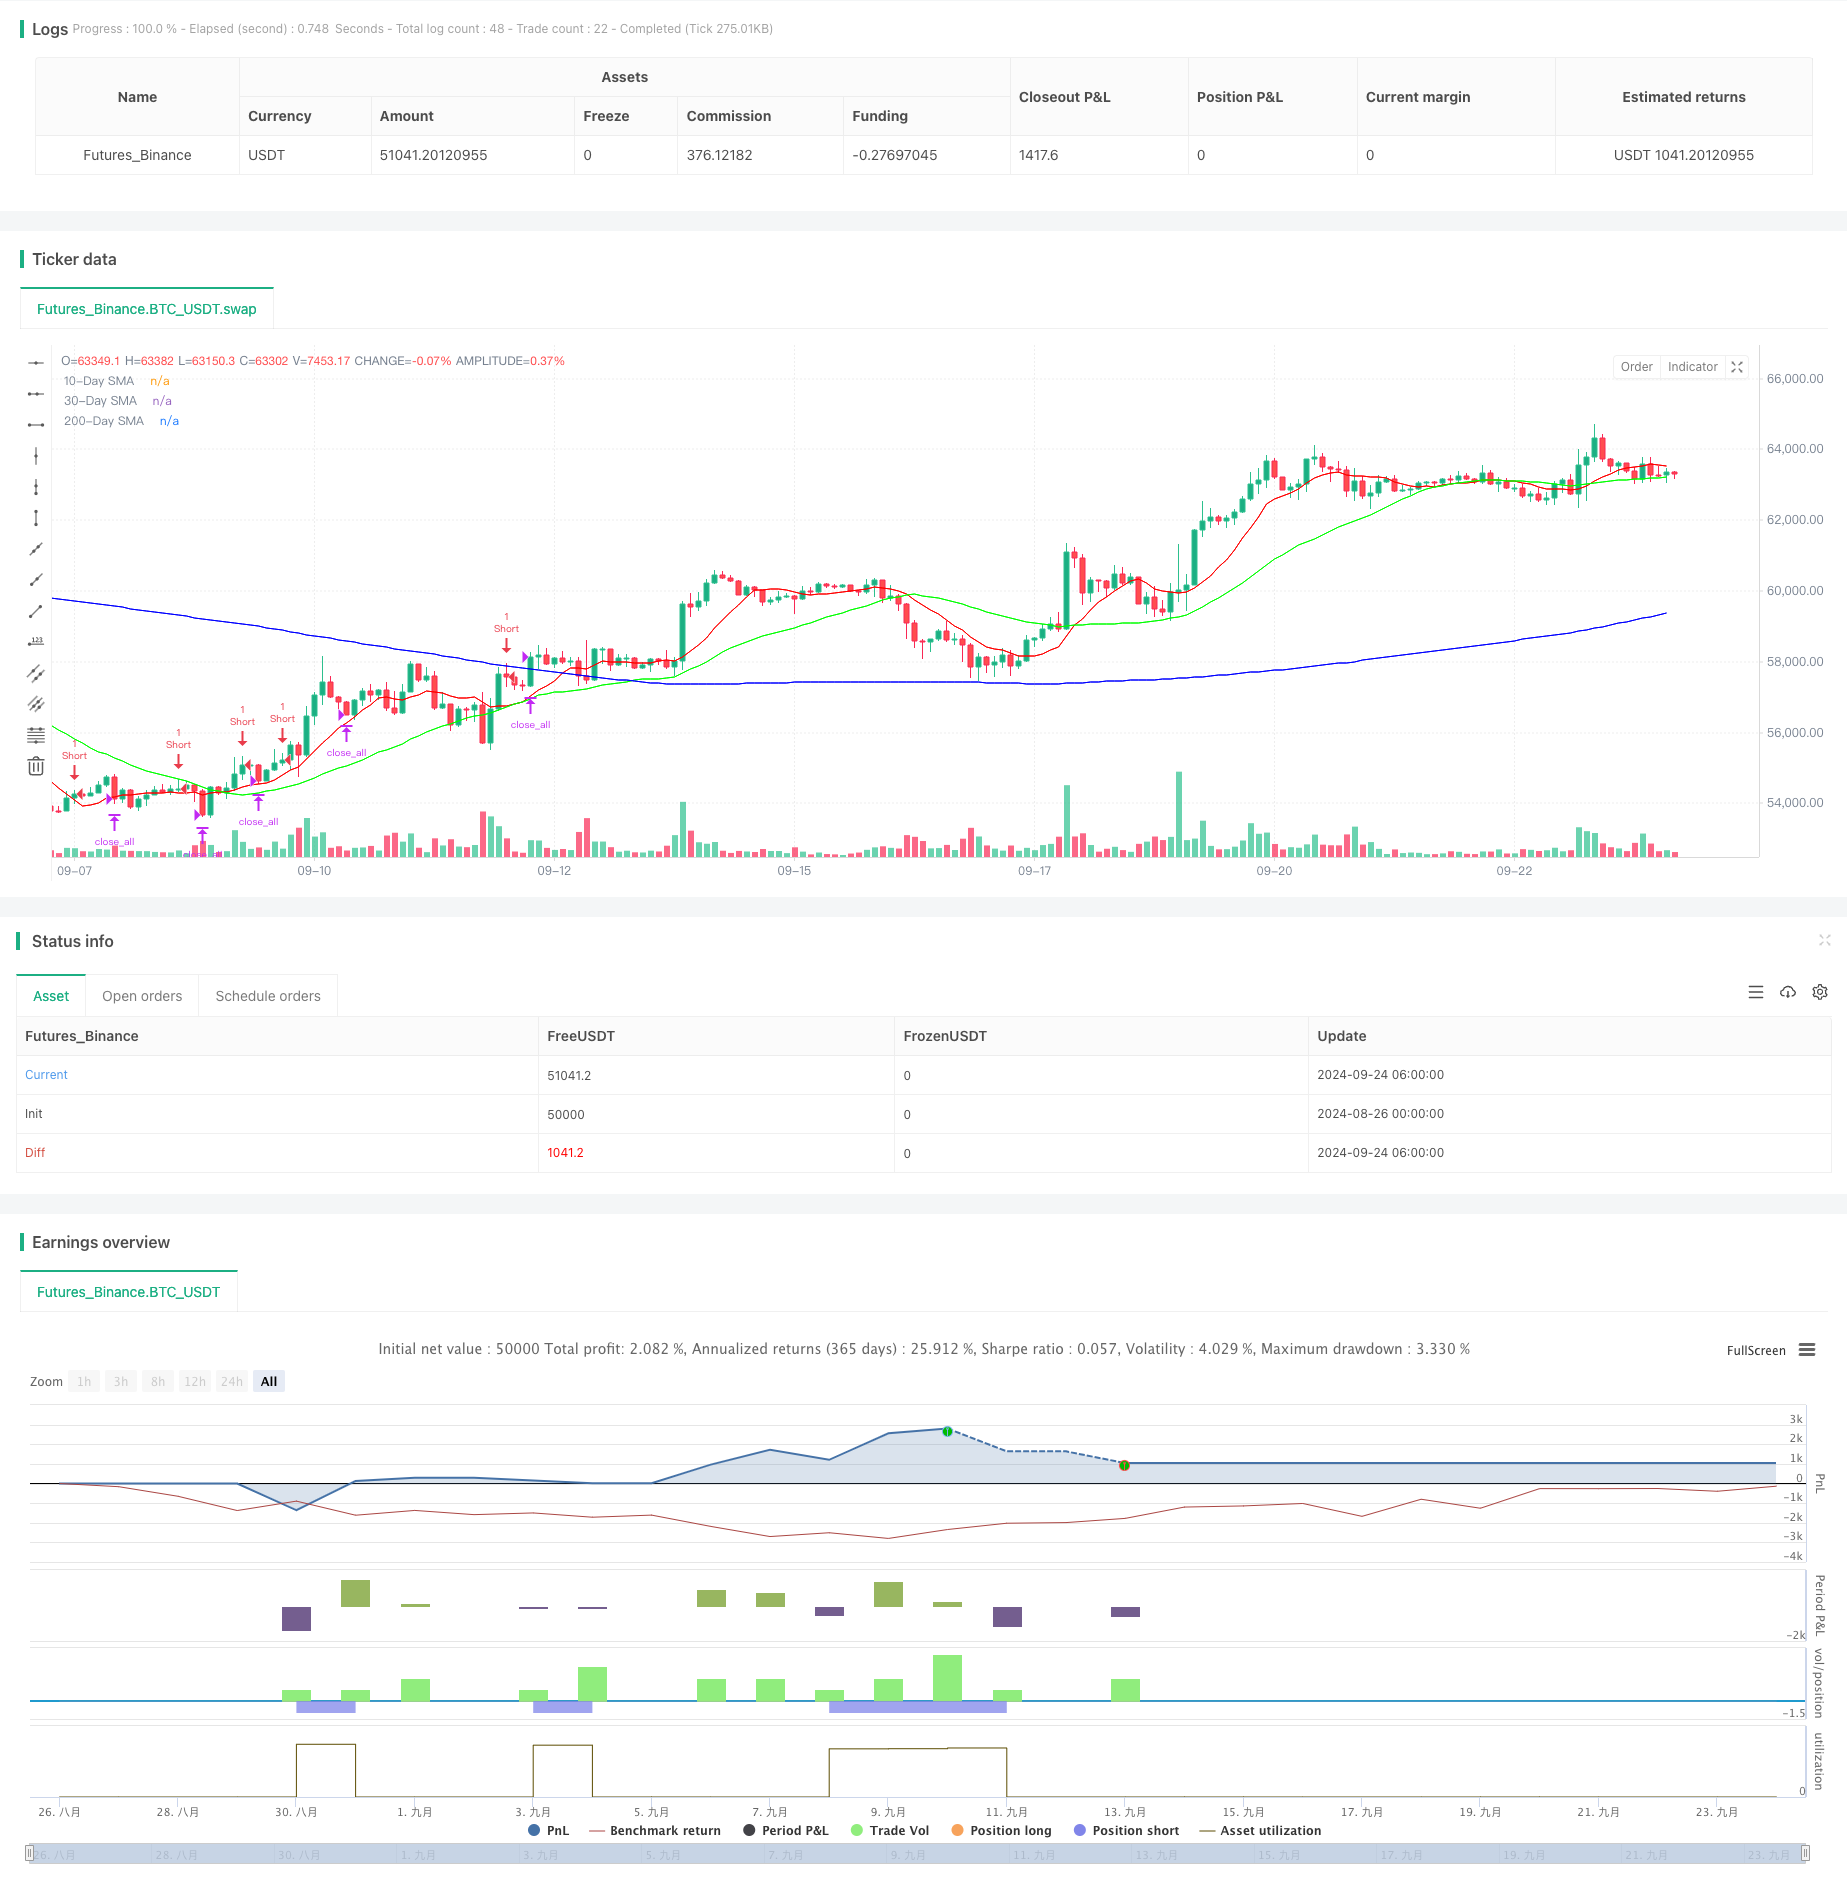
ダイナミックポジションマネジメントRSI超買い逆転戦略は,技術指標とダイナミックポジションマネジメントを組み合わせたショートライン取引戦略である.この戦略は,相対的に強い指標 ((RSI) と単純な移動平均 ((SMA) を利用して,潜在的超買い状態と逆転の機会を識別し,ポジションを分量的に構築することによってリスクと利益の比率を最適化します.戦略の核心思想は,資産価格が長期の下落傾向にあり,短期的な超買いが発生したときに空き場を空け,市場が超売りまたはトレンド転換の信号が発生したときに平仓することである.
戦略原則
この戦略の仕組みには以下の重要なステップが含まれています.
- 長期トレンド判定: 200日単行移動平均 ((SMA) を長期トレンドフィルターとして使用する. 策略は,価格が200日SMA以下である場合にのみ空白の機会を考慮する.
- 超買い状態の識別: 2サイクルRSI指標を用い,連続して2日間75より高い短期超買い状態を判断する.
- 積み重なる倉庫建設:初期倉庫建設は10%の倉庫建設で,その後価格の動向に応じて徐々に倉庫建設を行う.価格が前回の倉庫建設価格より高いときは,それぞれ20%,30%,40%の倉庫建設を行う.
- 退出条件: 2サイクルRSIが30を下回ったとき (超売り状態に入る可能性を示している) または10日SMA上30日SMAを突破したとき (トレンドの逆転が起こる可能性を示している),すべてのポジションを平らにする.
戦略的優位性
- リスク管理: 順次の倉庫建設とダイナミックなポジション管理により,単一取引のリスクのを効果的に制御する.
- トレンド追跡:長期トレンドを捉え,短期逆転の機会を識別するために,長期短期移動平均の組み合わせを使用する.
- 柔軟性:戦略のパラメータは,異なる市場環境と取引品種に応じて調整され,適応性が高い.
- 自動化実行: 戦略の論理が明確で,取引を自動化するためにプログラミングが容易である.
戦略リスク
- 市場リスク: 強い上昇状況下では,継続的な損失のリスクがある.
- 過剰加仓のリスク:分期加仓のメカニズムにより,誤ったシグナルで市場への過剰な露出が起こりうる.
- 流動性のリスク:流動性の低い市場では,大額取引が滑り点を増加させる可能性があります.
- 技術指標の限界:RSIやSMAなどの技術指標は,誤った取引決定につながる偽信号を生成する可能性があります.
戦略最適化の方向性
- 波動率指標の導入:ATR ((平均リアル波幅) など波動率指標を組み合わせて,ポジション構築とポジション値の動的調整.
- 楽観的な加仓論理:市場の変動程度に応じて加仓比率を動的に調整することを考えることができる.高波動期に過剰な加仓を避ける.
- 基本的フィルターを増やす:市場情緒指標やマクロ経済データなどの基本的要因を組み合わせて,入場信号の信頼性を向上させる.
- 回測最適化:大量の歴史的データを回測することで,各パラメータ設定を最適化し,戦略の安定性と収益性を向上させる.
要約する
ダイナミックポジション管理RSIオーバーバイ反転戦略は,技術分析とリスク管理を組み合わせたショートライン取引戦略である.この戦略は,RSIオーバーバイシグナルとSMAトレンド判断を利用して,市場の潜在的な反転機会を捉えることを目的としている.その分量的なポジション構築とダイナミックな退出メカニズムは,リスクとリターンの比率を最適化するのに役立ちます.しかし,この戦略を使用する際,投資家は,市場リスクと技術指標の局限性に注意を払い,実際の取引環境に応じて戦略のパラメータと論理を常に最適化する必要があります.合理的なリスク制御と継続的な戦略の最適化により,この戦略は,効果的な量化取引ツールになる可能性があります.
ストラテジーソースコード
/*backtest
start: 2024-08-26 00:00:00
end: 2024-09-24 08:00:00
period: 2h
basePeriod: 2h
exchanges: [{"eid":"Futures_Binance","currency":"BTC_USDT"}]
*/

//@version=5
strategy("TPS Short Strategy by Larry Conners", overlay=true)

// Define parameters as inputs
sma_length_200 = input.int(200, title="200-Day SMA Length")
rsi_length_2 = input.int(2, title="2-Period RSI Length")
sma_length_10 = input.int(10, title="10-Day SMA Length")
sma_length_30 = input.int(30, title="30-Day SMA Length")

// Define colors as RGB values
color_sma_200 = input.color(color.rgb(0, 0, 255), title="200-Day SMA Color") // Blue
color_sma_10 = input.color(color.rgb(255, 0, 0), title="10-Day SMA Color") // Red
color_sma_30 = input.color(color.rgb(0, 255, 0), title="30-Day SMA Color") // Green

// Calculate indicators
sma_200 = ta.sma(close, sma_length_200)
rsi_2 = ta.rsi(close, rsi_length_2)
sma_10 = ta.sma(close, sma_length_10)
sma_30 = ta.sma(close, sma_length_30)

// Define conditions
below_sma_200 = close < sma_200
rsi_2_above_75_two_days = rsi_2[1] > 75 and rsi_2 > 75
price_higher_than_entry = na(strategy.opentrades.entry_price(0)) ? false : close > strategy.opentrades.entry_price(0)

// Entry conditions
if (below_sma_200 and rsi_2_above_75_two_days and na(strategy.opentrades.entry_price(0)))
    strategy.entry("Short", strategy.short, qty=1) // Short 10% of the position

// Scaling in conditions
if (price_higher_than_entry)
    strategy.entry("Short2", strategy.short, qty=2) // Short 20% more of the position

if (price_higher_than_entry)
    strategy.entry("Short3", strategy.short, qty=3) // Short 30% more of the position

if (price_higher_than_entry)
    strategy.entry("Short4", strategy.short, qty=4) // Short 40% more of the position

// Exit conditions
exit_condition_rsi_below_30 = rsi_2 < 30
exit_condition_sma_cross = ta.crossover(sma_10, sma_30)

if (exit_condition_rsi_below_30 or exit_condition_sma_cross)
    strategy.close_all() // Close all positions

// Plot indicators
plot(sma_200, color=color_sma_200, title="200-Day SMA")
plot(sma_10, color=color_sma_10, title="10-Day SMA")
plot(sma_30, color=color_sma_30, title="30-Day SMA")