ガウスクロスオーバーEMAトレンドスリッページフォロー戦略

EMA RSI MACD ATR ADX
作成日: 2024-09-26 15:34:01 最終変更日: 2024-09-26 15:34:01
コピー: 1 クリック数: 497
1
フォロー
1617
フォロワー

ガウスクロスオーバーEMAトレンドスリッページフォロー戦略

概要

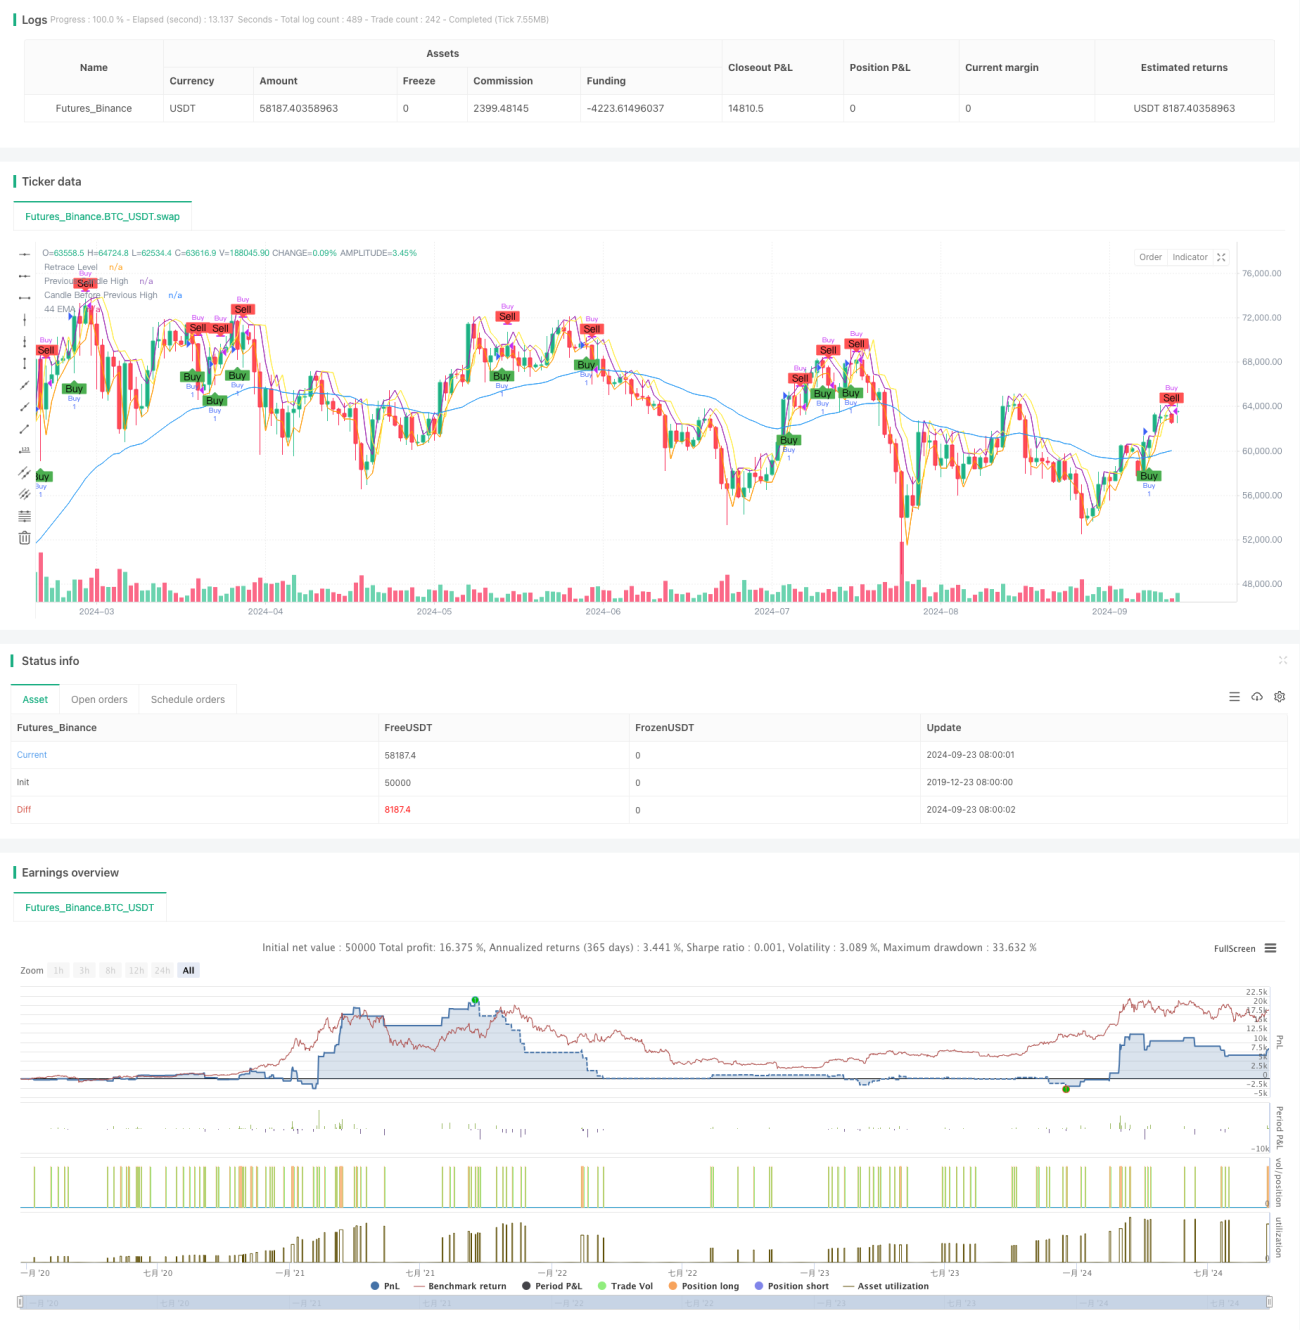
これは,44周期インデックス移動平均 ((EMA)) をベースにしたトレンド追跡戦略である.この戦略は,主に上昇傾向の中で買い機会を探し,EMAの傾斜,グラフの形状,価格の引き戻りなどの複数の条件を分析することによって入場タイミングを決定する.戦略は,2分と5分などの短い時間周期に適用され,短期価格の変動中の取引機会を捕捉することを目的としています.

戦略原則

  1. 44サイクルEMAと斜率を計算して,トレンドが十分に傾いているかどうかを判断する.
  2. 前方のの形状を分析し,陽線で,閉盘価格がEMAより高いことを要求する.
  3. 前の体の50%の位置に現在のが戻っているか観察する.
  4. 前回のの閉盤価格が前回のの最高価格より高いことを確認し,上昇傾向の持続性を検証する.
  5. すべての条件が満たされると,現在のの撤回位置でポジションを開き,多作する.
  6. 出る条件は,前が陰線または現在の低点が,前低点を下回るということです.

戦略的優位性

  1. 複数のフィルタリング:EMA,グラフ形状,価格の逆転などの複数の指標を組み合わせて,偽信号を効果的に減少させる.
  2. トレンドフォロー: EMAの斜率判断により,明らかな上昇傾向で取引を確実にして,勝率を向上させる.
  3. 引き下げ入場: 引き下げを入場ポイントとして利用し,購入価格を最適化し,潜在的に利益の余地を増やす.
  4. 柔軟性:異なる時間周期に適用でき,ショートラインと日内トレーダーに適しています.
  5. リスク管理: 明確なストップ・ロスの条件を設けることで,取引ごとにリスクを管理するのに役立ちます.

戦略リスク

  1. 遅滞性: EMAは遅滞の指標として,急激な変動の状況で反応が遅れる可能性があります.
  2. 偽突破:横盤整理区間では頻繁に偽突破信号が生じることがあります.
  3. 過剰取引: 波動性のある市場では,過剰取引が起こり,取引コストが増加する可能性があります.
  4. トレンドの逆転: 急速なトレンドの逆転は大きな損失をもたらす可能性があります.
  5. パラメータ感度:戦略効果はEMA周期などのパラメータ設定に敏感である.

戦略最適化の方向性

  1. RSIやMACDのような追加のフィルターを導入し,トレンドの強さと方向をさらに確認します.
  2. ダイナミックストップ:ATR指数を使用してダイナミックストップを設定し,市場の変動に適応する.
  3. 交通量分析を増やす:交通量指標を組み合わせて,入口信号の信頼性を高める.
  4. EMAサイクルを最適化:異なるEMAサイクルを反測し,最適なパラメータの組み合わせを見つけます.
  5. ADXのようなトレンド強度指標を追加し,強度のトレンドでのみ入場することを確認します.
  6. トレーリング・ストップのような,より精巧な戦略を設計した.

要約する

高スクロスEMAトレンドスライドポイントトラッキング戦略は,複数の技術指標を組み合わせたトレンドトラッキングシステムである.EMA,グラフ形状分析,価格逆転などの多次元的な判断により,この戦略は,上昇傾向を識別し,入場タイミングを最適化するのに優れた潜在性を示している.しかし,ユーザーは,過剰取引のリスクを制御し,異なる市場環境に対してパラメータを最適化することに注意する必要がある.追加の技術指標の導入とリスク管理メカニズムの改善により,この戦略は,短期取引においてより安定したパフォーマンスを期待している.

ストラテジーソースコード
/*backtest
start: 2019-12-23 08:00:00
end: 2024-09-24 08:00:00
period: 1d
basePeriod: 1d
exchanges: [{"eid":"Futures_Binance","currency":"BTC_USDT"}]
*/

//@version=5
strategy("Custom Strategy with EMA and Candle Conditions", overlay=true)

// Define parameters
ema_length = 44

// Calculate EMA
ema_44 = ta.ema(close, ema_length)

// Calculate the slope of the EMA
ema_slope = ta.ema(close, ema_length) - ta.ema(close[9], ema_length)

// Define a threshold for considering the EMA flat
flat_threshold = 0.5

// Check if the EMA is flat or inclined
ema_is_inclined = math.abs(ema_slope) > flat_threshold

// Define the previous candle details
prev_candle_high = high[1]
prev_candle_low = low[1]
prev_candle_close = close[1]
prev_candle_open = open[1]

// Candle before the previous candle (for high comparison)
candle_before_prev_high = high[2]

// Current candle details
current_candle_high = high
current_candle_low = low
current_candle_close = close
current_candle_open = open

// Previous to previous candle details
prev_prev_candle_low = low[2]

// Previous candle body and wick length
prev_candle_body = math.abs(prev_candle_close - prev_candle_open)
prev_candle_wick_length = math.max(prev_candle_high - prev_candle_close, prev_candle_close - prev_candle_low)

// Calculate retrace level for the current candle
retrace_level = prev_candle_close - (prev_candle_close - prev_candle_low) * 0.5

// Check if the previous candle's wick is smaller than its body
prev_candle_condition = prev_candle_wick_length < prev_candle_body

// Check if the previous candle is a green (bullish) candle and if the previous candle's close is above EMA
prev_candle_green = prev_candle_close > prev_candle_open
prev_candle_red = prev_candle_close < prev_candle_open
prev_candle_above_ema = prev_candle_close > ema_44

// Entry condition: The current candle has retraced to 50% of the previous candle's range, previous candle was green and above EMA, and the high of the current candle is above the retrace level, and EMA is inclined
entry_condition = prev_candle_close > candle_before_prev_high and
                   prev_candle_green and
                   prev_candle_above_ema and
                   current_candle_low <= retrace_level and
                   current_candle_high >= retrace_level and ema_is_inclined

// Exit condition
exit_condition = (strategy.position_size > 0 and prev_candle_red) or (strategy.position_size > 0 and current_candle_low < prev_candle_low)

// Ensure only one trade is open at a time
single_trade_condition = strategy.position_size == 0

// Plot EMA for visualization
plot(ema_44, color=color.blue, title="44 EMA")

// Plot conditions for debugging
plotshape(series=entry_condition and single_trade_condition, location=location.belowbar, color=color.green, style=shape.labelup, text="Buy")
plotshape(series=exit_condition, location=location.abovebar, color=color.red, style=shape.labeldown, text="Sell")

// Print entry condition value on chart
var label entry_label = na
if (entry_condition and single_trade_condition)
    entry_label := label.new(bar_index, low, text="Entry Condition: TRUE", color=color.green, textcolor=color.white, size=size.small, yloc=yloc.belowbar)
else
    entry_label := label.new(bar_index, high, text="Entry Condition: FALSE", color=color.red, textcolor=color.white, size=size.small, yloc=yloc.abovebar)

// Debugging: Plot retrace level and other key values
plot(retrace_level, color=color.orange, title="Retrace Level")
plot(prev_candle_high, color=color.purple, title="Previous Candle High")
plot(candle_before_prev_high, color=color.yellow, title="Candle Before Previous High")

// Trigger buy order if entry condition and single trade condition are met
if (entry_condition and single_trade_condition)
    strategy.entry("Buy", strategy.long)

// Trigger sell order if exit condition is met
if (exit_condition)
    strategy.close("Buy")