多要素動的適応トレンド追跡戦略

1
Follow
1781
Followers
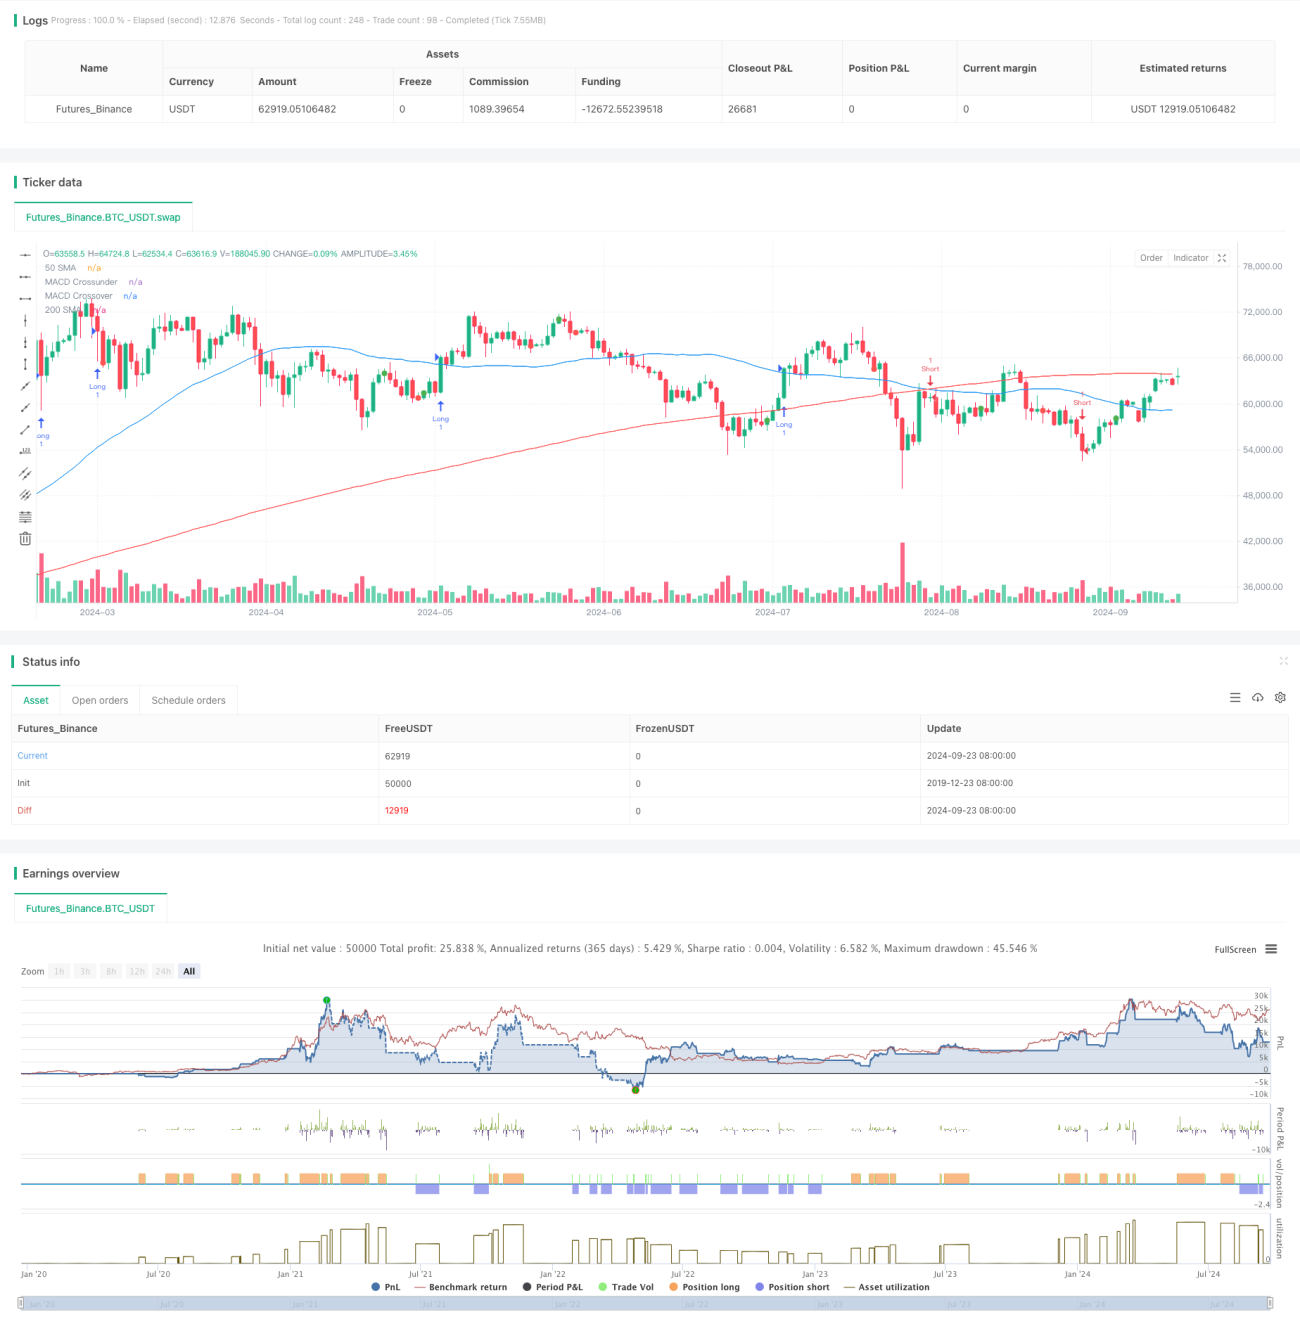
概要
多要素動的適応型トレンドトラッキング戦略は,複数の技術指標を組み合わせた体系化された取引方法である.この戦略は,移動平均の収束散度指標 ((MACD),相対的に強い指標 ((RSI),平均真波幅 ((ATR) と単純な移動平均線 ((SMA) などを活用して,市場のトレンドを捉え,エントリーとアウトアウトを最適化する.機械戦略は,複数の指標を確認することにより,取引の成功率を向上させ,同時に,異なる市場環境に適応し,リスク管理と利益の最大化のためのバランスを実現するストップ・ロスと利益の方法を使用する.
戦略原則
この戦略の核心原則は,複数の技術指標の協同作用によって市場のトレンドを識別し,確認することです.具体的には:
- MACD指標の金叉と死叉を使用して,潜在的なトレンド転換点を捉えます.
- RSIは,価格動向を把握し,過度に買入または売却を避けるために使用されます.
- 50日および200日SMAの位置関係を使用して,全体的な市場動向を判断する.
- ATR指標の動的設定のストップ・ローズと利益のレベルを適用して,市場の変動に対応する.
策略は以下の条件を満たす時に多額のポジションを開きます:MACD線で信号線を穿越し,RSIは70を下回り,価格は50日SMA上,50日SMAは200日SMA上である.反対の条件は空き信号を誘発する.策略は,2倍ATRをストップ・ロズとして使用し,3倍ATRをリターン・リターンとして使用し,1:1:5のリスク・リターンを確保する.
戦略的優位性
- 多次元確認:複数の指標を組み合わせることで,戦略は市場状況をより全面的に評価し,偽信号の影響を軽減します.
- ダイナミックなリスク管理:ATRを利用して,戦略が異なる市場の変動環境に適応できるように,ストップ・ローズと利益のレベルを動的に調整する.
- トレンド追跡と動力の組み合わせ:戦略は,長期のトレンドを考慮し (SMA経由),短期の動力を考慮し (MACDとRSI経由) 持続性の強いトレンドを捕捉するのに役立ちます.
- システム化された意思決定:明確な入場・出場規則は主観的な判断を減らし,取引の規律を維持するのに役立ちます.
- 柔軟性:戦略のパラメータは,異なる市場と取引品種に応じて調整され,強い適応性を持っています.
戦略リスク
- 振動性市場の不振: 明確なトレンドがない市場では,戦略はしばしば偽信号を生じ,取引コストを増加させる可能性があります.
- 遅滞性:移動平均などの遅滞指標を使用しているため,戦略はトレンドの初期にいくつかのチャンスを逃す可能性があります.
- 技術指標に過度に依存し,基本的な要素を無視し,重要な出来事や報道の際に誤った判断をすることがあります.
- パラメータの感受性:戦略の性能は指標のパラメータの設定に敏感であり,市場の変化に対応するために定期的に最適化する必要があります.
- 引き戻しリスク:急激な市場逆転時に,2倍ATRの止損設定は,リスクを効果的に制御するのに不十分である.
戦略最適化の方向性
- 波動性フィルターの導入: 低波動性の環境で取引を一時停止することを検討して,波動的な市場における偽信号を減らす.
- 基本要素を統合する: 経済データ,企業決算などの情報と組み合わせて,戦略の全体性を向上させる.
- 戦略の安定性を高めるために,ブリン帯,イチモク雲図などの他の指標を導入することができます.
- 適応パラメータを実現する:市場状況の動向に応じて指標パラメータを調整する機械学習モデルを開発する.
- 市場状態の細かい分類:異なる市場環境 (トレンド,区間,高波動など) を区別し,戦略パラメータを対象に調整する.
- タイムフレーム分析の強化: 複数のタイムサイクルを組み合わせたシグナルにより,取引決定の正確性が向上する.
要約する
多要素動的適応型トレンドトラッキング戦略は,複数の技術指標を統合することによって,トレーダーに体系化され,量化可能な取引方法を提供します. この戦略は,傾向が明確な市場で優れたパフォーマンスを発揮し,中長期の動きを効果的に捉えることができます. ダイナミックなリスク管理機構と多次元信号確認プロセスは,取引の安定性と信頼性を高めるのに役立ちます.
Source
Pine
Strategy parameters
Related strategies
Comment
All comments (0)
No data
- 1