
ダイナミックトレンド追跡EMAクロス戦略は,指数移動平均 ((EMA) を組み合わせ,レジスタンスレベルを支えるトレンド追跡原理の定量取引戦略である.この戦略は,主に短期と長期のEMAのクロスを利用して市場トレンドを判断し,高低点突破を組み合わせて入場のタイミングを探します.この戦略には,市場トレンドを捕捉し,リスクを制御するために,ストップ,ストップとストップを追跡するリスク管理機構も含まれています.
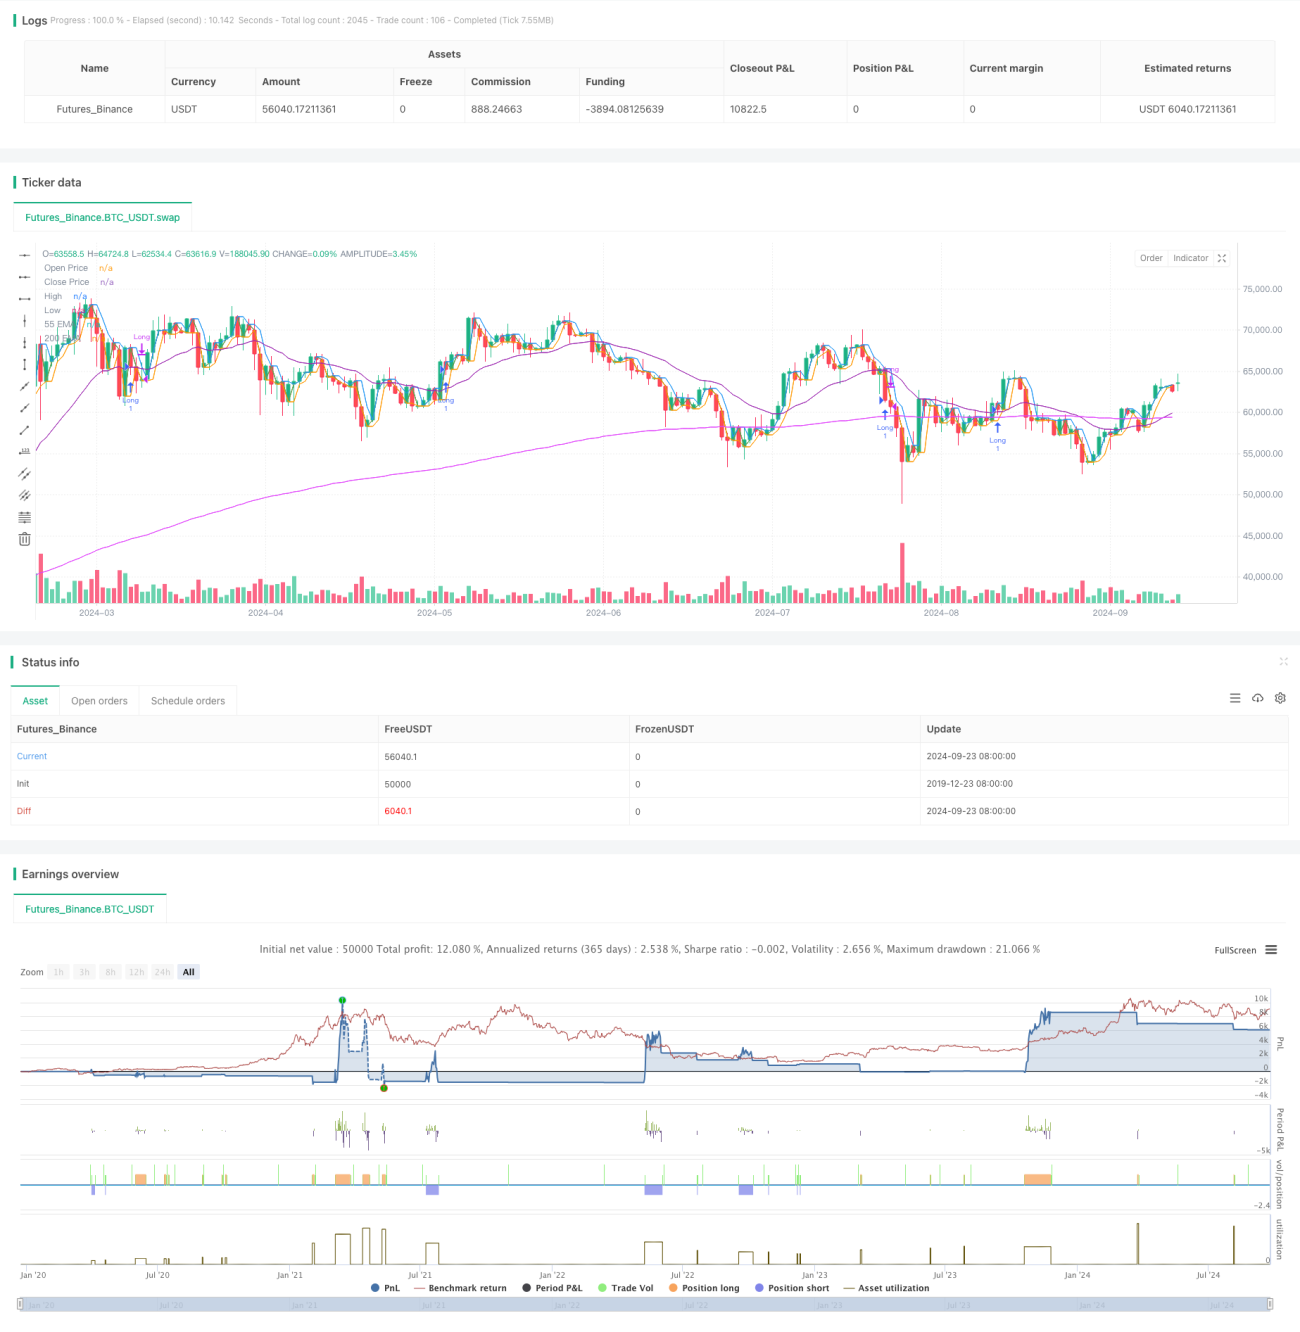
トレンド判断:55周期EMAと200周期EMAの相対的な位置を使用して市場のトレンドを判断する.55周期EMAが200周期EMA上にあるとき,上昇傾向として判断する.逆に下降傾向である.
入口信号:
出場条件:
リスク管理:
トレンド追跡: EMAの交差と高低点の突破により,戦略は市場トレンドを効果的に捉え,収益の機会を向上させる.
ダイナミックな適応:単純移動平均 (SMA) ではなくEMAを使用し,市場変化に戦略をより迅速に適応させる.
多重確認:トレンド判断,価格突破,EMA交差などの多重条件を組み合わせて,偽信号の可能性を低減する.
リスク管理: リスク管理と利益のロックに役立つ内蔵の止まれ,止まれ,止まれを追跡する仕組み.
ビジュアルアシスト:戦略は,入場と出場のシグナルをグラフにマークし,トレーダーが直観的に理解し,反射分析を容易にします.
柔軟性: パラメータを入力することで,ユーザーは異なる市場と個人の好みに合わせて戦略のパフォーマンスを調整できます.
振動市場のリスク:横盤または振動市場の場合,偽信号が頻繁に発生し,過度な取引と損失を引き起こす可能性があります.
遅滞性:EMAは本質的に遅滞の指標であり,激しい波動の市場では最適な入場または出場のタイミングを逃す可能性があります.
パラメータの感受性:戦略の性能はEMA周期,高低点周期などのパラメータの設定に大きく依存し,異なる市場には異なる最適パラメータが必要になる可能性がある.
トレンド反転のリスク: 強いトレンド反転の際に,戦略は迅速に反応し得ず,大きな引き下がりを引き起こす可能性があります.
技術指標への過度依存: 戦略は基本的要素を考慮していないため,重大ニュースやイベントの発生時に不十分なパフォーマンスを発揮する可能性があります.
取引量指標を追加:取引量分析を組み合わせて,特にトレンドの強さと潜在的反転を判断する際に,信号の信頼性を向上させることができます.
波動率のフィルタを導入する.ATR ((真波幅) またはBollinger Bandsなどの指標を追加することで,戦略が高波動環境でより良く動作するのを助けることができます.
オプティマイズされたストップメカニズム: 変動率に基づく動的ストップを固定ポイントのストップではなく,異なる市場条件に適応するように使用することを考慮することができます.
多時間枠分析:より長い時間枠分析を導入することで,トレンド判断の正確性を高め,偽突破を減らすことができる.
RSIやMACDのような市場情緒指標に追加すると,潜在的に偽の信号をフィルターするのに役立ちます.
適応パラメータ:戦略が最近の市場条件に応じてEMA周期および他のパラメータを自動的に調整できる仕組みを開発する.
動的トレンド追跡EMAクロス戦略は,複数の技術指標を組み合わせた量化取引システムで,EMAクロスと価格突破によって市場トレンドを捉える.この戦略の優点は,トレンドへの感受性と内蔵されたリスク管理メカニズムにあるが,同時に,波動的な市場とパラメータの最適化の課題にも直面している.将来の最適化の方向は,信号品質の向上,適応性の強化,市場分析のより高度な導入に焦点を当てることができる.中長期のトレンド取引機会を探している投資家にとって,これは考慮すべき戦略の枠組みである.しかし,実際のアプリケーションでは,特定の市場特性と個人リスクの好みに応じて,深い反測とパラメータの最適化が必要である.
/*backtest
start: 2019-12-23 08:00:00
end: 2024-09-24 08:00:00
period: 1d
basePeriod: 1d
exchanges: [{"eid":"Futures_Binance","currency":"BTC_USDT"}]
*/
//@version=5
strategy("gucci 1.0 ", overlay=true)
// Input parameters
boxClose = input(true, title="Enable on Box Close")
timeframe = input.timeframe("1", title="Timeframe")
highLowPeriod = input.int(2, title="High/Low Period")
ema55Period = input.int(21, title="55 EMA Period")
ema200Period = input.int(200, title="200 EMA Period")
takeProfitTicks = input.int(55, title="Take Profit (in Ticks)")
stopLossTicks = input.int(30, title="Stop Loss (in Ticks)")
trailingStopTicks = input.int(25, title="Trailing Stop (in Ticks)")
// Security data
openPrice = request.security(syminfo.tickerid, timeframe, open)
closePrice = request.security(syminfo.tickerid, timeframe, close)
// Calculate high and low for the user-defined period
highCustomPeriod = ta.highest(closePrice, highLowPeriod)
lowCustomPeriod = ta.lowest(closePrice, highLowPeriod)
// Calculate customizable EMAs
ema55 = ta.ema(closePrice, ema55Period)
ema200 = ta.ema(closePrice, ema200Period)
// Plotting the open, close, high/low, and EMAs for reference
plot(openPrice, color=color.red, title="Open Price")
plot(closePrice, color=color.green, title="Close Price")
plot(highCustomPeriod, color=color.blue, title="High", linewidth=1)
plot(lowCustomPeriod, color=color.orange, title="Low", linewidth=1)
plot(ema55, color=color.purple, title="55 EMA", linewidth=1)
plot(ema200, color=color.fuchsia, title="200 EMA", linewidth=1)
// Determine trend direction
bullishTrend = ema55 > ema200
bearishTrend = ema55 < ema200
// Define entry conditions
longCondition = bullishTrend and ta.crossover(closePrice, lowCustomPeriod) and ta.crossover(closePrice, ema55)
shortCondition = bearishTrend and ta.crossunder(closePrice, highCustomPeriod) and ta.crossunder(closePrice, ema55)
// Entry conditions and auto take profit, stop loss, and trailing stop
if (boxClose)
if (longCondition)
takeProfitPriceLong = closePrice + takeProfitTicks * syminfo.mintick
stopLossPriceLong = closePrice - stopLossTicks * syminfo.mintick
strategy.entry("Long", strategy.long)
strategy.exit("Take Profit Long", "Long", limit=takeProfitPriceLong, stop=stopLossPriceLong, trail_offset=trailingStopTicks * syminfo.mintick)
// Plot visual signal for long entry
label.new(bar_index, closePrice, "Buy", color=color.green, textcolor=color.white, style=label.style_label_up, size=size.small)
// Send alert for long entry
alert("Long entry signal - price: " + str.tostring(closePrice), alert.freq_once_per_bar)
if (shortCondition)
takeProfitPriceShort = closePrice - takeProfitTicks * syminfo.mintick
stopLossPriceShort = closePrice + stopLossTicks * syminfo.mintick
strategy.entry("Short", strategy.short)
strategy.exit("Take Profit Short", "Short", limit=takeProfitPriceShort, stop=stopLossPriceShort, trail_offset=trailingStopTicks * syminfo.mintick)
// Plot visual signal for short entry
label.new(bar_index, closePrice, "Sell", color=color.red, textcolor=color.white, style=label.style_label_down, size=size.small)
// Send alert for short entry
alert("Short entry signal - price: " + str.tostring(closePrice), alert.freq_once_per_bar)
// Optional: Define exit conditions
longExitCondition = bearishTrend or ta.crossunder(closePrice, ema55)
shortExitCondition = bullishTrend or ta.crossover(closePrice, ema55)
if (longExitCondition)
strategy.close("Long")
// Plot visual signal for long exit
label.new(bar_index, closePrice, "Sell Exit", color=color.red, textcolor=color.white, style=label.style_label_down, size=size.small)
// Send alert for long exit
alert("Long exit signal - price: " + str.tostring(closePrice), alert.freq_once_per_bar)
if (shortExitCondition)
strategy.close("Short")
// Plot visual signal for short exit
label.new(bar_index, closePrice, "Buy Exit", color=color.green, textcolor=color.white, style=label.style_label_up, size=size.small)
// Send alert for short exit
alert("Short exit signal - price: " + str.tostring(closePrice), alert.freq_once_per_bar)