
1
Follow
1781
Followers
概要
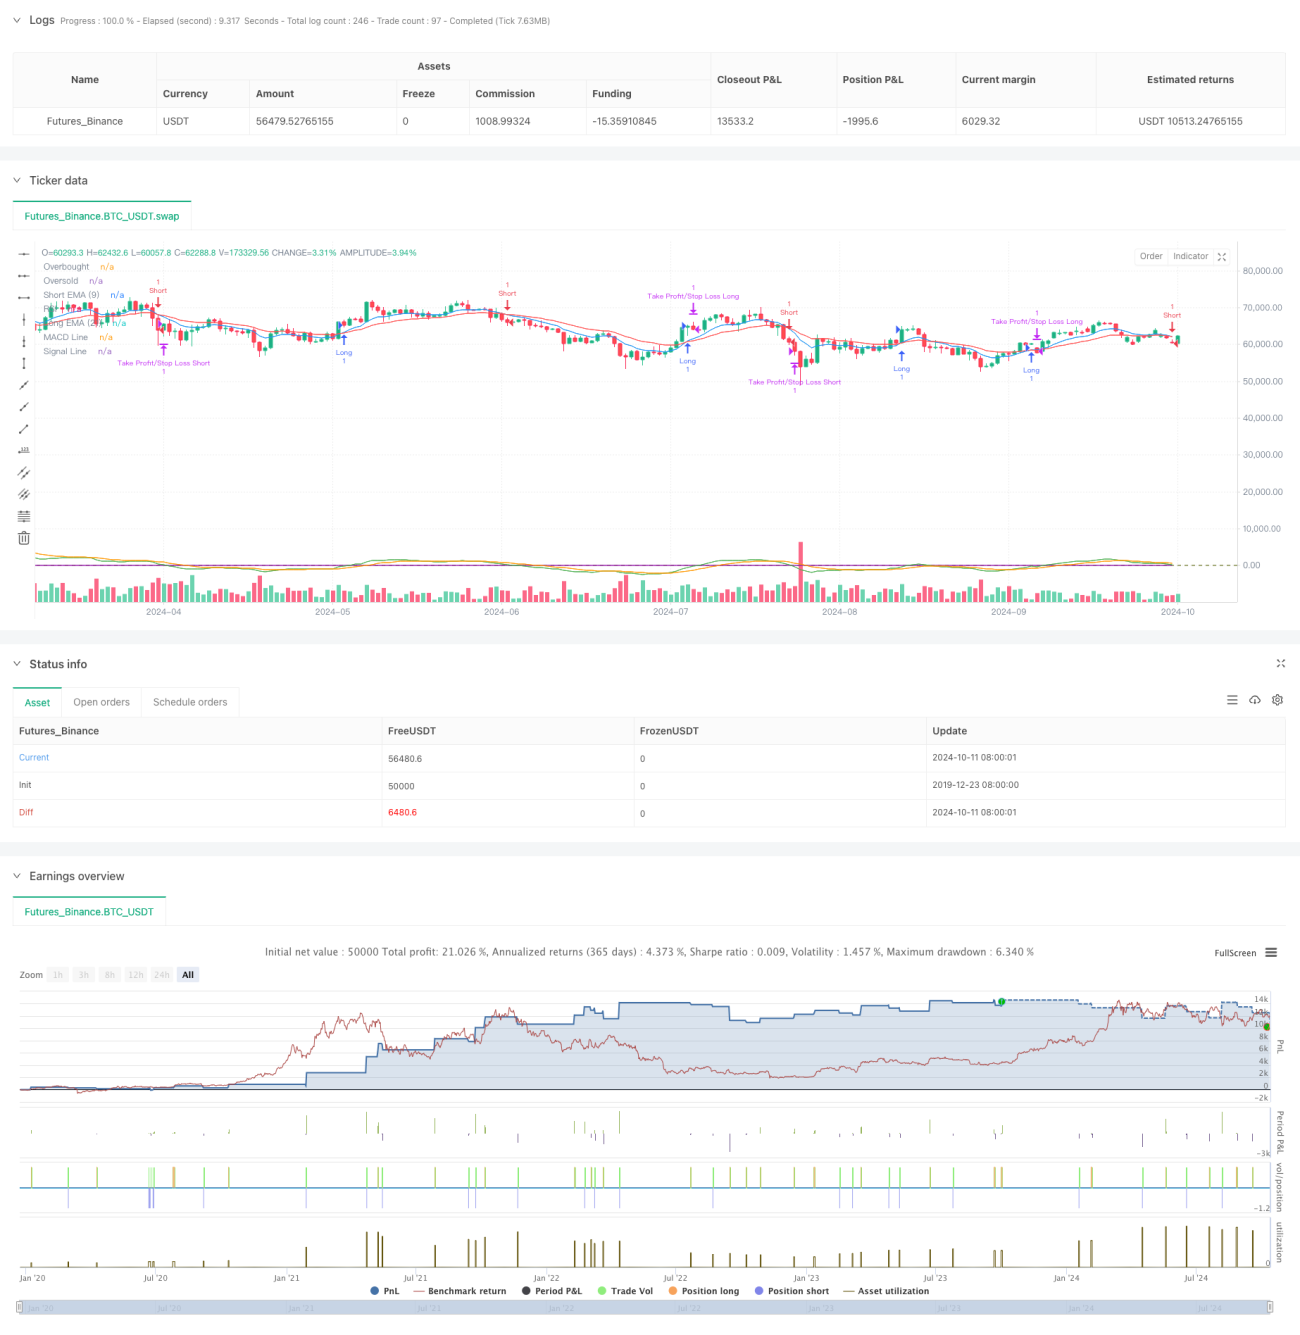
この戦略は,複数の技術指標を組み合わせた動量取引システムであり,同時に柔軟なストップ・ロスの仕組みを統合している.この戦略は,主にRSI,EMA,MACDの3つの一般的な技術指標の交差信号を使用して,市場の傾向と動力を判断し,その基礎で取引決定を行う.この戦略は,資金管理とリスク管理を最適化するために,パーセントのストップ・ロスとリスク・リターン・比率の概念も導入している.
戦略原則
この戦略の核となる原則は,複数の指標の協同作用によって潜在的な取引機会を識別することです.具体的には:
- RSI (相対的に強い指数) を用いて,市場が過買か過売か判断する.
- 短期と長期のEMA (指数移動平均) を交差してトレンドの変化を確認する.
- MACD ((移動平均の収束散度) の柱状図と信号線の関係により,動量について検証する.
これらの指標が特定の条件を同時に満たしているときに,戦略は取引信号を誘発する.例えば,短期EMAで長期EMA,RSIが超買いレベルを下回り,MACD柱状図が信号線より高いときに,多行シグナルが生じる.逆の条件は空行シグナルを誘発する.
さらに,戦略は,トレーダーが自身のリスクの好みに応じて適切なストップとストップのレベルを設定できるように,百分位のストップ・ロスの仕組みを組み込んでいる.リスク/利益比率の導入は,資金管理戦略をさらに最適化している.
戦略的優位性
- マルチ指標の協調性:RSI,EMA,MACDを組み合わせることで,戦略は市場を複数の角度から分析することができ,信号の信頼性を高めます.
- 柔軟な資金管理: ストップ・ローズ・パーセンテージとリスク・リターン・比率の設定により,戦略は異なる市場環境と個人のリスク好みに合わせて調整できます.
- トレンド・トラッキングとモテンションの組み合わせ: EMA交差はトレンドシグナルを提供し,RSIとMACDは強力な市場の動きを捉えるのに役立つモテンションの要素を補う.
- ビジュアルサポート: 戦略は,市場状況と戦略の論理をトレーダーに直感的に理解できるように,重要な指標をグラフに描いています.
- パラメータ調整:主要指標の周期と<unk>値は,入力パラメータで調整することができ,戦略の適応性を高めます.
戦略リスク
- 過剰取引: 変動する市場では,複数の指標がしばしば矛盾する信号を発し,過剰取引を引き起こす可能性があります.
- 遅滞性:使用されているすべての指標は,本質的に遅滞性であり,急速な変化の市場において反応が遅れる可能性がある.
- 偽の突破のリスク:EMA交差策は市場の騒音に敏感で,偽の突破シグナルを生成する可能性がある.
- パラメータ感性:戦略のパフォーマンスは選択されたパラメータに強く依存し,異なる市場環境では異なるパラメータ設定が必要になる可能性があります.
- 市場情緒の考慮の欠如:この戦略は,基本的要因や市場情緒を考慮せずに,技術的な指標を中心に作られており,重要なニュースイベントの発生時に不良な結果をもたらす可能性があります.
戦略最適化の方向性
- 波動率フィルターの導入:ATR (=真波幅) の追加を考慮して,低波動率の環境で取引頻度を削減し,信号品質を向上させる.
- トレンド強度フィルターを追加:例えば,ADX (平均トレンド指数) を使用して,強いトレンドでのみ取引を保証し,揺れ動いている市場での頻繁な取引を避ける.
- ダイナミックストップローズ:市場の波動的なダイナミックに合わせてストップローズレベルを調整できます.例えばATRの倍数を使用して設定します.
- タイムフィルター:取引時間ウィンドウの制限を増やし,波動性の高い開盘と閉盘の時間を避けます.
- 取引量分析を加える:OBV ((エネルギー潮) またはCMF ((資金流向指標) のような取引量指標を組み合わせて,価格動向の有効性を検証する.
- 機械学習最適化:機械学習アルゴリズムを使用して,変化する市場環境に対応するために,戦略パラメータを動的に調整し,最適化します.
要約する
この多指数クロスダイナミクス取引戦略は,RSI,EMA,MACDなどの技術指標を総合的に利用し,柔軟なストップ&ロストメカニズムと組み合わせることで,トレーダーに包括的な取引システムを提供しています.戦略の優点は,市場を多角的に分析する能力と柔軟なリスク管理方法にあります.しかし,すべての取引戦略と同様に,過剰取引やパラメータ感受性などのリスクにも直面しています.
Source
Pine
/*backtest
start: 2019-12-23 08:00:00
end: 2024-10-12 08:00:00
period: 1d
basePeriod: 1d
exchanges: [{"eid":"Futures_Binance","currency":"BTC_USDT"}]
*/

//@version=5
strategy("Crypto Futures Day Trading with Profit/Limit/Loss", overlay=true, margin_long=100, margin_short=100)

// Parameters for the strategyStrategy parameters
Related strategies
Comment
All comments (0)
No data
- 1