EMA/MACD/RSIクロスオーバー戦略

1
Follow
1780
Followers
概要
EMA/MACD/RSIクロス戦略は,複数の技術指標を組み合わせた量化取引戦略である.この戦略は,市場動向を判断し取引信号を生成するために,主にインデックス移動平均 ((EMA),移動平均の相似散乱指数 ((MACD) と相対的に強いインデックス ((RSI) のクロス信号を使用する.この戦略は,動的ストップ損失を設定し,リスクを効果的に制御するために平均真波幅 ((ATR) も導入している.この複数の指標を組み合わせる方法は,取引信号の正確性と信頼性を向上させることを目的としている.
戦略原則
この戦略の核心となる原則は,複数の指標の交差と配合によって,出場と入場のタイミングを決定することである:
- EMA交差: 急速EMAと遅いEMAの交差は,短期トレンドの変化を捕捉するために使用される.
- MACD交差:MACD線とシグナル線の交差は,中期トレンド転換を確認するために使用される.
- RSIフィルター:RSI指標を使用して,偽の突破の可能性をフィルタリングし,RSIが超買いまたは超売り領域にない場合にのみ取引を行う.
- ATRストップ:ATRを動的ストップに設定し,市場の変動に応じてストップポジションを調整する.
買い条件は,急速EMA上での遅いEMAまたはMACD線上での信号線を穿え,同時にRSIが超売りレベルより高い.売る条件は,その逆である.戦略は,現在のポジション保有状態をチェックすることで,繰り返しポジション開設を回避し,資金利用の効率性を高める.
戦略的優位性
- 多指標結合: EMA,MACD,RSIを組み合わせることで,戦略は異なる角度から取引信号を確認し,誤判のリスクを軽減します.
- トレンド追跡と反転の組み合わせ: EMAとMACDの使用は,トレンドを捉え,潜在的な反転の機会を早期に発見することができます.
- ダイナミックリスク管理:ATRベースのダイナミックストップを使用して,ストップポイントが市場の変動に応じて自動的に調整できるようにする.
- 柔軟性: 戦略のパラメータは,異なる市場と時間枠に合わせて調整され,適応性があります.
- 過剰取引を避ける:既存保有者をチェックすることで,重複開設を回避し,取引頻度とコストを制御するのに役立ちます.
戦略リスク
- 振動市場の不振:横軸振動市場では,頻繁に偽信号が生み出され,過度な取引と損失を引き起こす可能性があります.
- パラメータの感受性: 戦略の性能はEMA,MACD,RSIのパラメータ設定に大きく依存し,異なる市場では頻繁に調整する必要がある.
- 遅滞性:遅滞の指標として,EMAとMACDは,激しい波動の市場の中で十分に迅速に反応しない可能性があります.
- 信号の衝突:複数の指標が時折相互に矛盾する信号を発し,意思決定の難易度を高めます.
- 技術分析への過度の依存: 戦略は基本的な要素を考慮していないため,重大ニュースやイベントの影響で失効する可能性があります.
戦略最適化の方向性
- 波動性フィルターの導入: 波動性の高い環境では,戦略パラメータの調整や,激しい市場の変動に対応するために取引を一時停止することを考えることができます.
- トレンドの強さ判断を増やす:ADXなどのトレンドの強さ指標を導入し,強いトレンドの市場ではより積極的な戦略を採用し,弱いトレンドの市場ではより保守的な戦略を採用する.
- ストップメカニズムを最適化:現在の戦略はストップ・ロスのみで,ATRまたは固定パーセントに基づくストップメカニズムを追加し,利益をロックすることを検討することができます.
- タイムフレームの連結:複数のタイムフレームでシグナルを検証することを考え,取引決定の信頼性を向上させる.
- 取引量分析:価格動向の有効性を確認するために,OBVまたはCMFのような取引量指標を組み合わせる.
- 機械学習最適化:機械学習アルゴリズムを使用して指標パラメータを動的に調整し,市場の変化に戦略の適応性を向上させる.
要約する
EMA/MACD/RSI交差策略は,多指標の協同作用によって取引機会を識別し,リスクを管理するための総合的な技術分析取引システムである.この戦略の主要な優点は,多次元的な市場分析の視点と柔軟なリスク管理機構である.しかし,ユーザーは,異なる市場環境における戦略のパフォーマンスの違いに注意し,特定の取引品種と市場状況に合わせてパラメータを最適化する必要があります.
Source
Pine
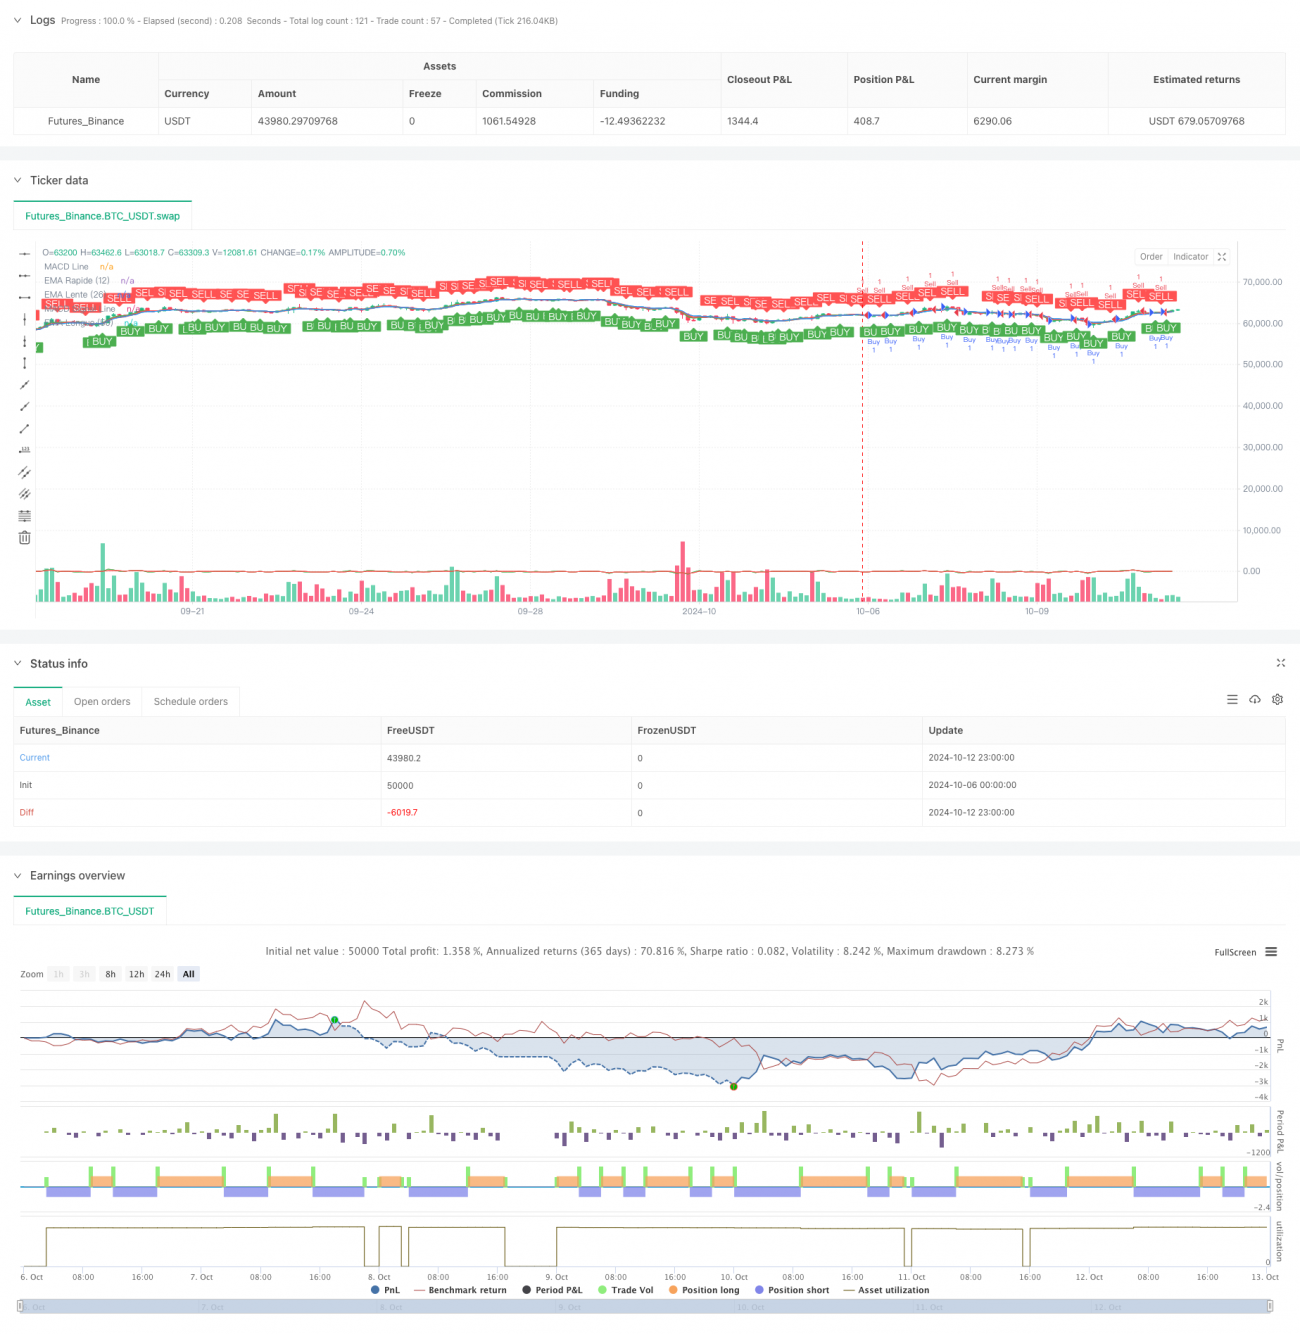
/*backtest
start: 2024-10-06 00:00:00
end: 2024-10-13 00:00:00
period: 3h
basePeriod: 3h
exchanges: [{"eid":"Futures_Binance","currency":"BTC_USDT"}]
*/

//@version=5
strategy("Mister Buy / sell signals", overlay=true, shorttitle="Mister Buy / sell signals")

// ─────────────────────────────────────────────────────────────Strategy parameters
Related strategies
Comment
All comments (0)
No data
- 1