
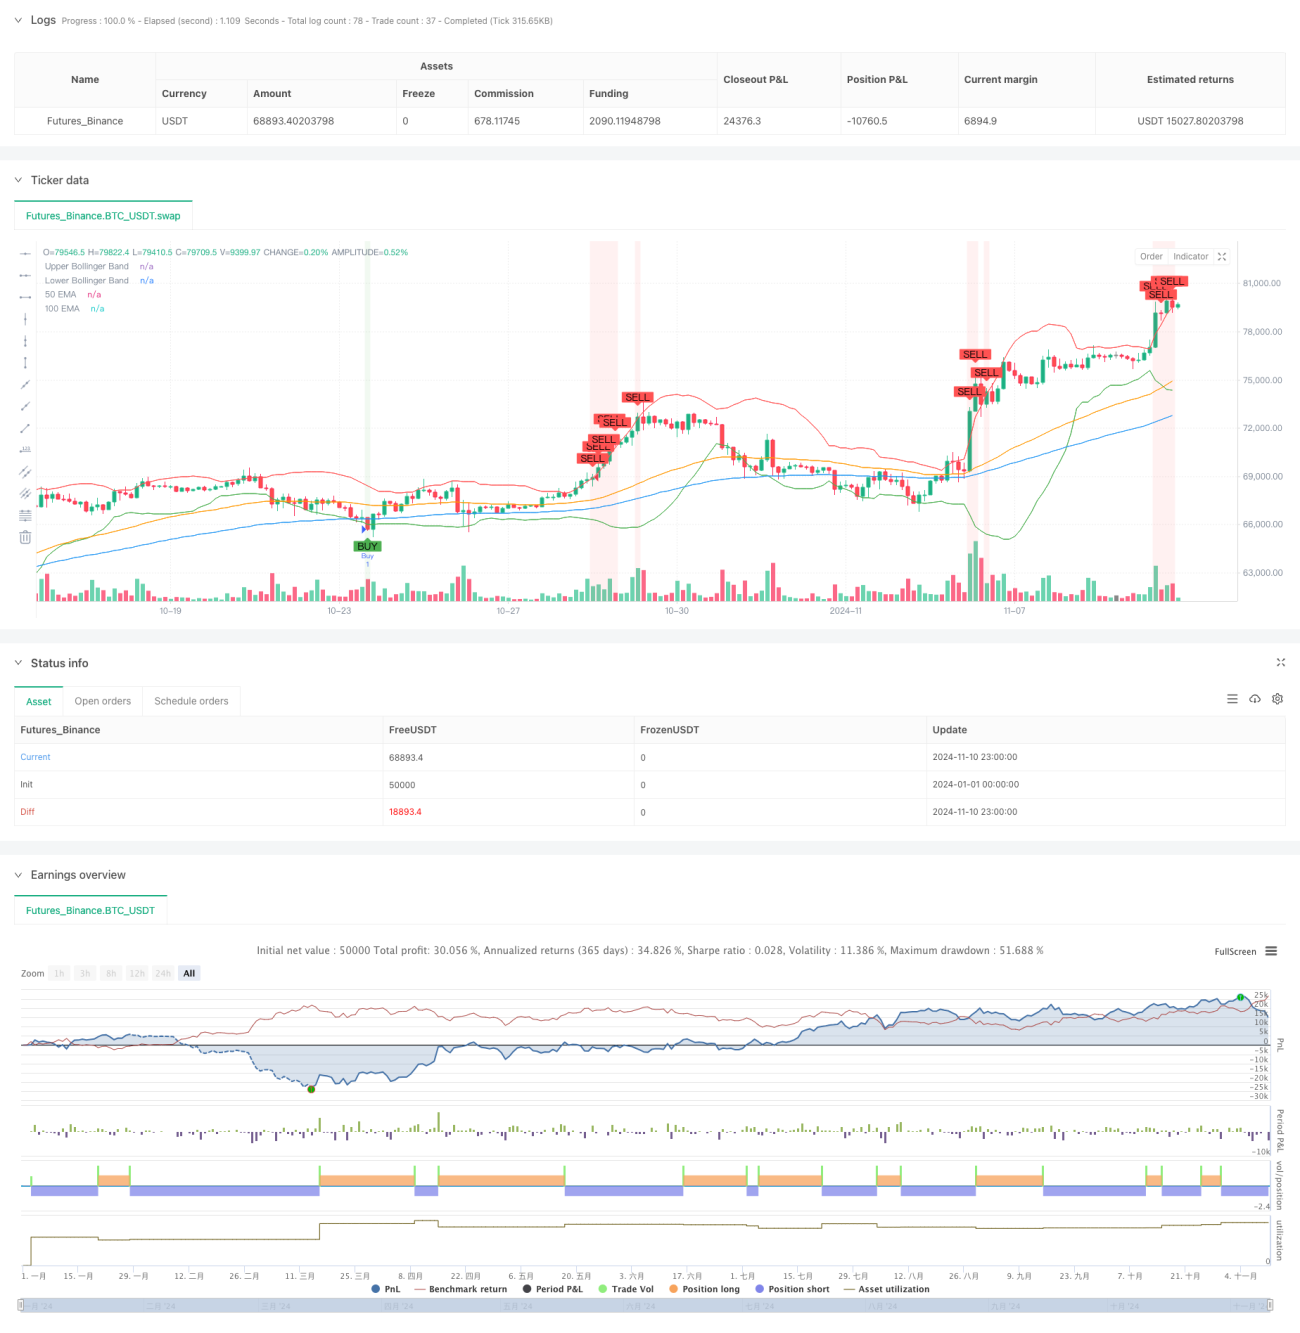
この戦略は,平均回帰とトレンド追跡を組み合わせた混合戦略システムであり,主にRSI,ブリン帯,および複数のEMA指標の組み合わせによって,市場の超買超売の機会を捉えるための戦略である. 戦略は,伝統的な技術分析指標に基づいて,トレンド確認と範囲の振動の判断を増加させ,戦略の正確性を効果的に向上させる.
戦略は,取引シグナルを確認するために三重検証メカニズムを採用する. まず,RSI指標によって超買い超売り領域を識別し,RSIが30以下または70以上であるときに初期シグナルをトリガーする.次に,ブリン帯 ((BB)) を価格変動範囲の参照として使用し,価格が上線または下線を突破したときにさらなるシグナルを確認する.最後に,100/50日EMAの相対的な位置と波動性によって市場の傾向を判断し,トレンドの方向が前2つのシグナルと一致するときにのみ取引を実行する.戦略は,整体市場を識別するためにEMAの波動率判断も加える.
この戦略は,複数の技術指標の協同作用によって,安定性を保証しながら,戦略の柔軟性を兼ね備えています. 戦略の論理は明確で,実装方法は簡潔で,実用的な価値が優れています. 合理的なパラメータ最適化とリスク管理により,戦略は,異なる市場環境で安定したパフォーマンスを維持することが期待されています.
/*backtest
start: 2024-01-01 00:00:00
end: 2024-11-11 00:00:00
period: 3h
basePeriod: 3h
exchanges: [{"eid":"Futures_Binance","currency":"BTC_USDT"}]
*/
//@version=5
strategy("BTC Dominance Analysis Strategy (Improved)", overlay=true)
// Input Parameters
rsi_period = input(14, title="RSI Period")
bb_period = input(20, title="Bollinger Band Period")
bb_std_dev = input(2.0, title="Bollinger Std Dev")
ema_period = input(100, title="100 EMA Period")
ema_30_period = input(30, title="30 EMA Period")
ema_50_period = input(50, title="50 EMA Period")
// RSI Calculation
rsi_value = ta.rsi(close, rsi_period)
// Bollinger Bands Calculation
basis = ta.sma(close, bb_period)
dev = bb_std_dev * ta.stdev(close, bb_period)
upper_bb = basis + dev
lower_bb = basis - dev
// EMA Calculation
ema_100 = ta.ema(close, ema_period)
ema_30 = ta.ema(close, ema_30_period)
ema_50 = ta.ema(close, ema_50_period)
// Determine EMA trends
range_bound_ema = math.abs(ema_100 - ta.sma(ema_100, 10)) < ta.stdev(ema_100, 10)
uptrend_ema = ema_100 > ema_50
downtrend_ema = ema_100 < ema_50
// Long Condition: All 3 conditions must be met
// 1. RSI < 30
// 2. BTC Dominance < lower Bollinger Band
// 3. 100 EMA must be range-bound or in an uptrend (but NOT in a downtrend)
long_condition = (rsi_value < 30) and (close < lower_bb) and (range_bound_ema or uptrend_ema)
// Short Condition: All 3 conditions must be met
// 1. RSI > 70
// 2. BTC Dominance > upper Bollinger Band
// 3. 100 EMA must be range-bound or in a downtrend (but NOT in an uptrend)
short_condition = (rsi_value > 70) and (close > upper_bb) and (range_bound_ema or downtrend_ema)
// Plot Buy and Sell Signals for Debugging
plotshape(long_condition, title="Buy Signal", location=location.belowbar, color=color.green, style=shape.labelup, text="BUY")
plotshape(short_condition, title="Sell Signal", location=location.abovebar, color=color.red, style=shape.labeldown, text="SELL")
// Execute Buy Trade
if (long_condition)
strategy.entry("Buy", strategy.long)
// Execute Sell Trade
if (short_condition)
strategy.entry("Sell", strategy.short)
// Plot Bollinger Bands and EMA
plot(upper_bb, color=color.red, title="Upper Bollinger Band")
plot(lower_bb, color=color.green, title="Lower Bollinger Band")
plot(ema_100, color=color.blue, title="100 EMA")
plot(ema_50, color=color.orange, title="50 EMA")
// plot(rsi_value, "RSI", color=color.purple)
// Display background color for Buy and Sell signals
bgcolor(long_condition ? color.new(color.green, 90) : na, title="Buy Background")
bgcolor(short_condition ? color.new(color.red, 90) : na, title="Sell Background")