フィボナッチリトレースメントとエクステンションの複数指標定量取引戦略
EMA
作成日:
2024-11-12 10:51:02
最終変更日:
2024-11-12 10:51:02
コピー:
5
クリック数:
701
1
フォロー
1750
フォロワー
概要
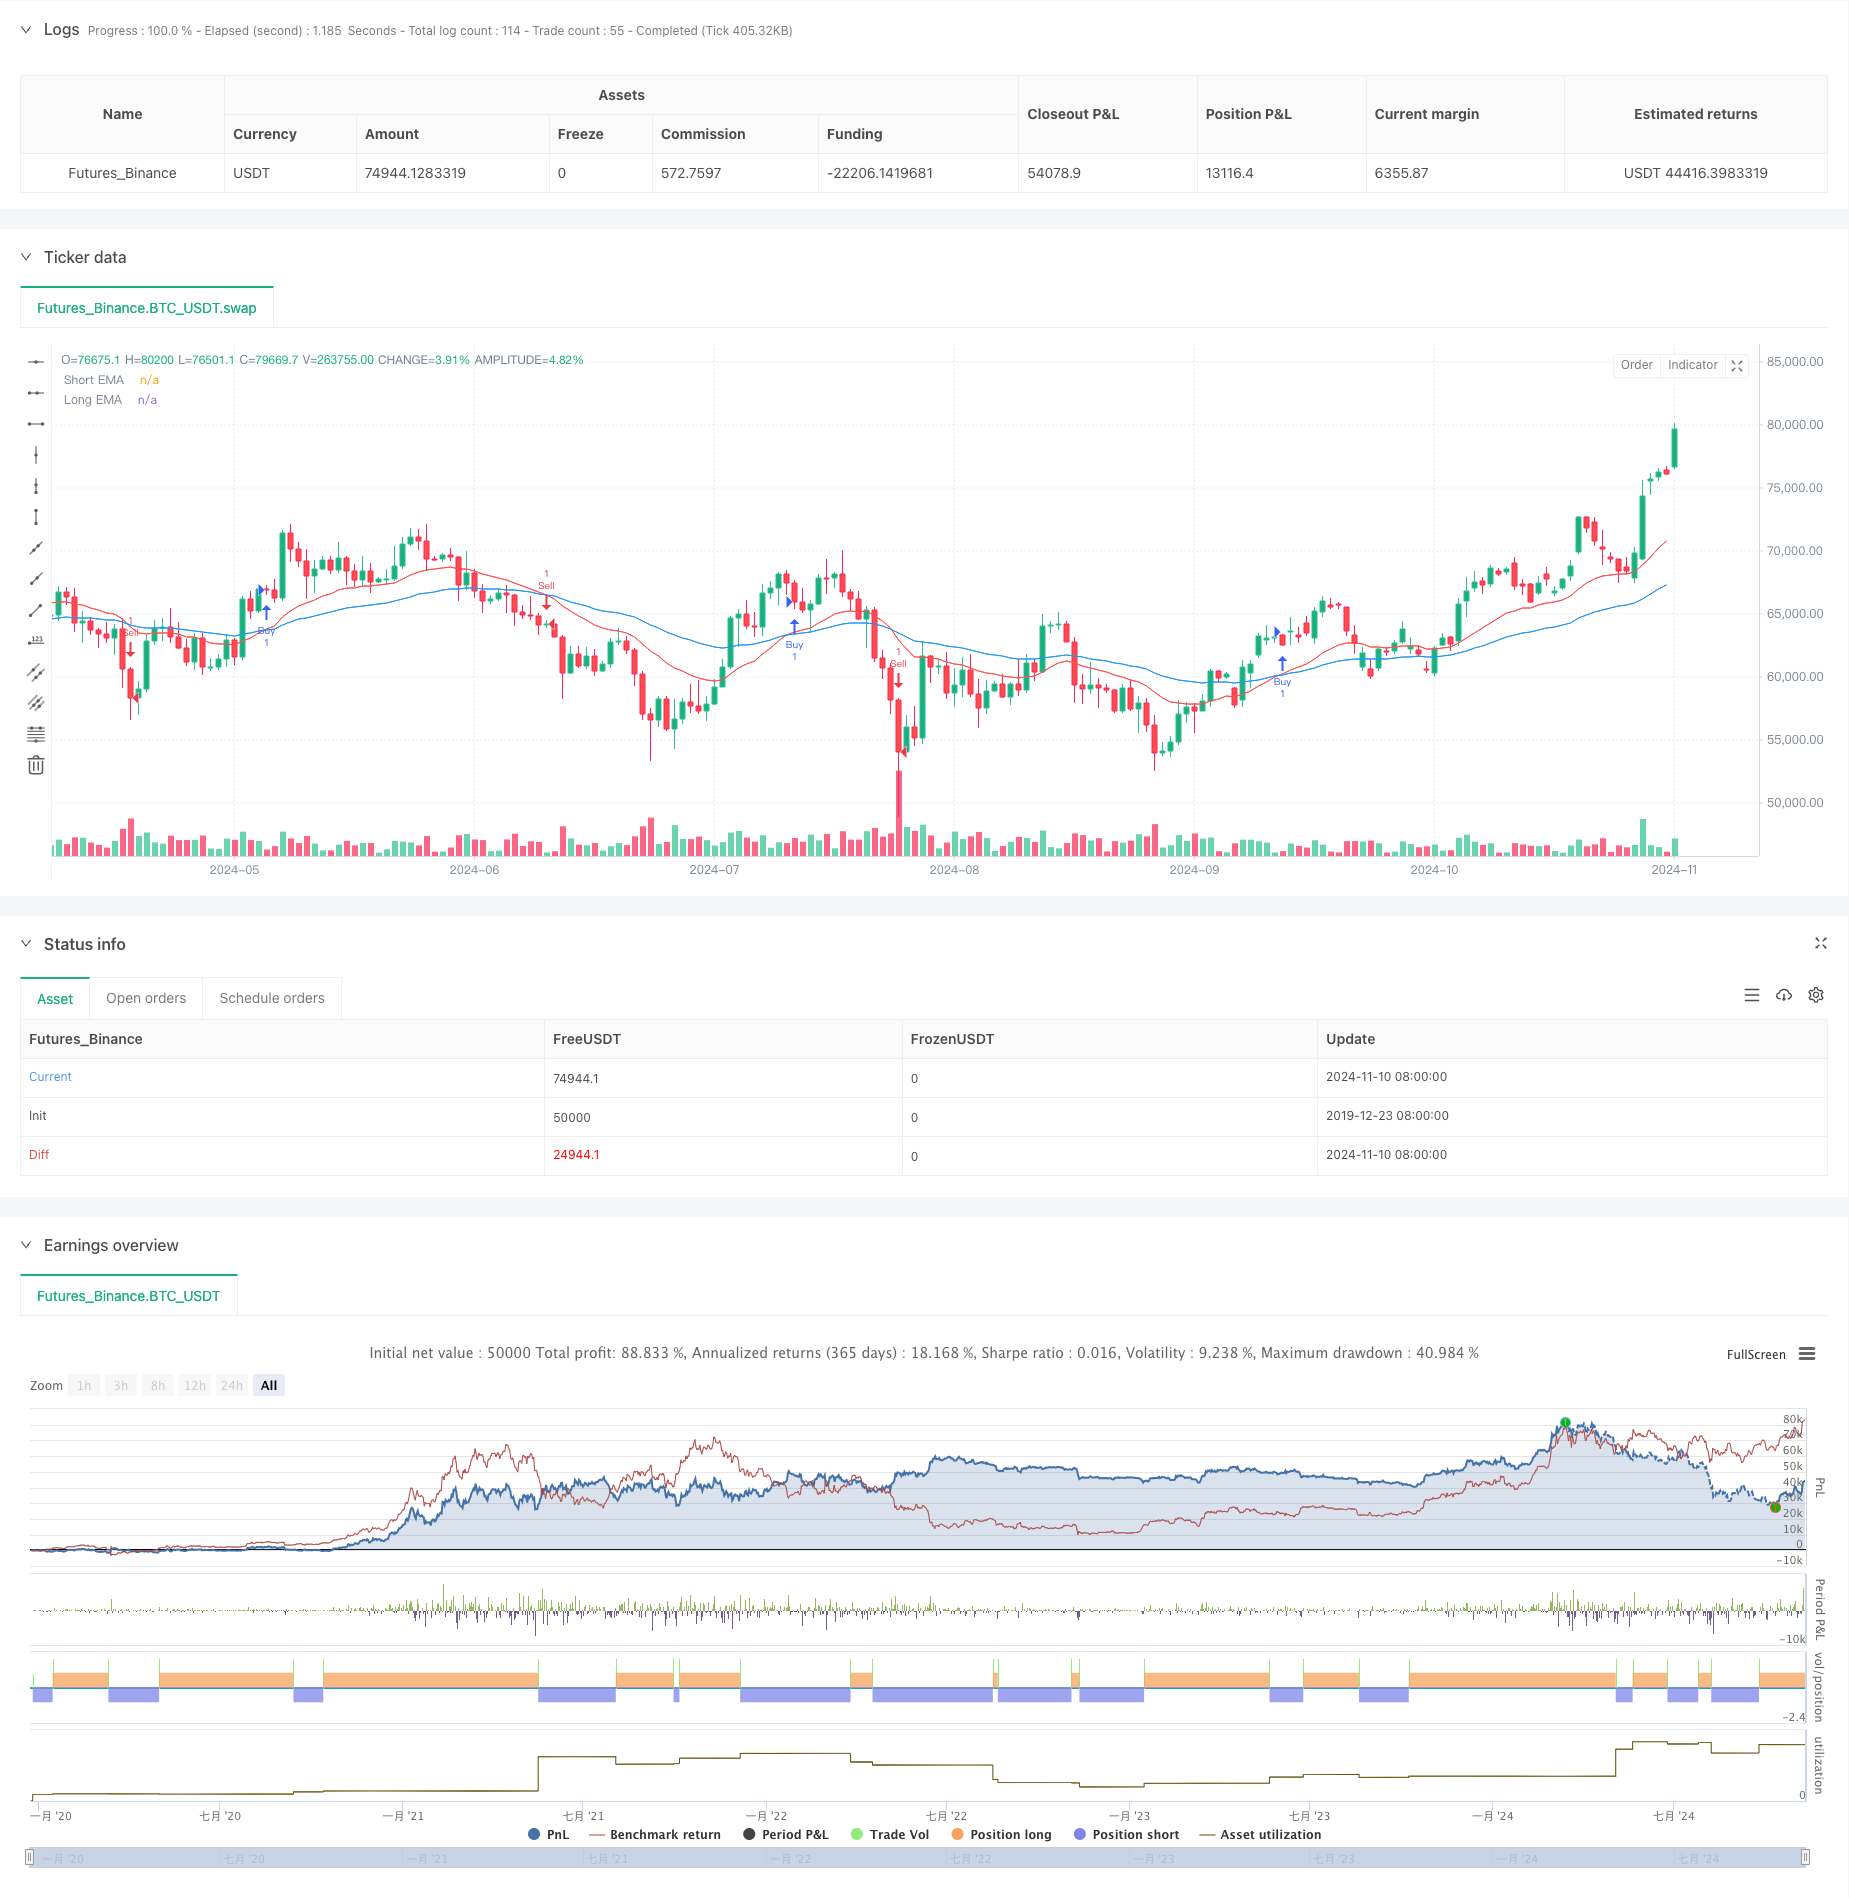
この戦略は,フィボナッチの引き戻しと延長レベルに基づいて,EMA平均線のトレンド判断と組み合わせた複合型定量取引システムである.戦略は,市場の重要なサポートレジスタンス値を識別して,トレンド信号と組み合わせて取引する.システムは20サイクルと50サイクルEMA平均線を使用して,市場のトレンドを判断し,その基礎でフィボナッチの引き戻しレベルを利用して,最適な取引機会を探します.
戦略原則
戦略の核心的な論理には3つの主要な部分が含まれています. まず,価格の波動区間を決定するために,ほぼ10周期の最高値と最低値を計算します. 次に,その区間に基づいて5つの重要なフィボナッチ逆転レベルを計算します (.236,0.382,0.5,0.618,0.786); 最後に,20と50周期EMAの交差でトレンド方向を決定します.
戦略的優位性
- トレンドトラッキングと価格逆転の2つの取引理念を組み合わせ,取引の正確性を向上させる
- フィボナッチ数列を重要な価格レベルとして使用し,これらのレベルは市場において強い心理的意味を持つ
- EMA平均線でトレンドを判断し,横断市場での頻繁な取引を避ける
- 簡潔で理解し,維持しやすいシステム設計
- 異なる時間周期に適用され,強い適応性を持つ
戦略リスク
- 市場が激しく波動する中で,誤ったシグナルが生じる可能性があります.
- トレンドの持続性により,波動的な市場では不良な結果が出る可能性があります.
- 市場が遅れている可能性のある,歴史的な高低をベースに,撤退レベルを計算する.
- 入口点の選択が不十分で,遠隔の停止位置につながる可能性がある.
- システムにダイナミックなポジション管理の仕組みがない
戦略最適化の方向性
- 取引量指標の導入により,トレンド判断の精度が向上
- ダイナミック・ストップ・メカニズムを増やし,リスクをより良く管理する
- 市場ペースに合わせて,撤回レベルを最適化する計算周期
- 波動率のフィルターで高波動期間の取引を避ける
- 市場状況に応じて保有量を調整するより柔軟なポジション管理システムを設計
要約する
この戦略は,古典的な技術分析ツールと組み合わせて,比較的完全な取引システムを構築している. 改善が必要な場所があるが,全体的な枠組みは市場への良好な適応性を持っている. 継続的な最適化と改善によって,この戦略は実際の取引でより良いパフォーマンスを期待している.
ストラテジーソースコード
/*backtest
start: 2019-12-23 08:00:00
end: 2024-11-11 00:00:00
period: 1d
basePeriod: 1d
exchanges: [{"eid":"Futures_Binance","currency":"BTC_USDT"}]
*/

//@version=5
strategy("Fibonacci Retracement and Extension Strategy", overlay=true)

// Define the Fibonacci levels for retracement and extension
fibRetracementLevels = array.new_float(5)
array.set(fibRetracementLevels, 0, 0.236)
array.set(fibRetracementLevels, 1, 0.382)
array.set(fibRetracementLevels, 2, 0.5)
array.set(fibRetracementLevels, 3, 0.618)
array.set(fibRetracementLevels, 4, 0.786)

fibExtensionLevels = array.new_float(5)
array.set(fibExtensionLevels, 0, 1.618)
array.set(fibExtensionLevels, 1, 2.618)
array.set(fibExtensionLevels, 2, 3.618)
array.set(fibExtensionLevels, 3, 4.236)
array.set(fibExtensionLevels, 4, 5.618)

// Calculate the high and low prices for the last 10 bars
highPrice = ta.highest(high, 10)
lowPrice = ta.lowest(low, 10)

// Calculate the Fibonacci retracement levels
fibRetracement = array.new_float(5)
for i = 0 to 4
    array.set(fibRetracement, i, highPrice - (highPrice - lowPrice) * array.get(fibRetracementLevels, i))

// Calculate the trend using the Exponential Moving Average (EMA)
shortEMA = ta.ema(close, 20)
longEMA = ta.ema(close, 50)

// Define the trend conditions
isUptrend = shortEMA > longEMA
isDowntrend = shortEMA < longEMA

// Generate buy and sell signals
var float lastFibRetracementLevel = na
var float lastFibExtensionLevel = na

// Buy condition: price crosses above the highest retracement level
if (isUptrend)
    for i = 0 to 4
        if (close > array.get(fibRetracement, i))
            lastFibRetracementLevel := array.get(fibRetracement, i)
            strategy.entry("Buy", strategy.long)

// Sell condition: price crosses below the lowest retracement level
if (isDowntrend)
    for i = 0 to 4
        if (close < array.get(fibRetracement, i))
            lastFibRetracementLevel := array.get(fibRetracement, i)
            strategy.entry("Sell", strategy.short)

// Plotting the Fibonacci levels on the chart
// for i = 0 to 4
//     line.new(bar_index[10], array.get(fibRetracement, i), bar_index, array.get(fibRetracement, i), color=color.new(color.blue, 70), width=1)

// Plot the EMAs
plot(shortEMA, color=color.red, title="Short EMA")
plot(longEMA, color=color.blue, title="Long EMA")