ADX(平均方向指数)とボリュームトレンドダイナミックフォロー戦略

1
Follow
1781
Followers
概要
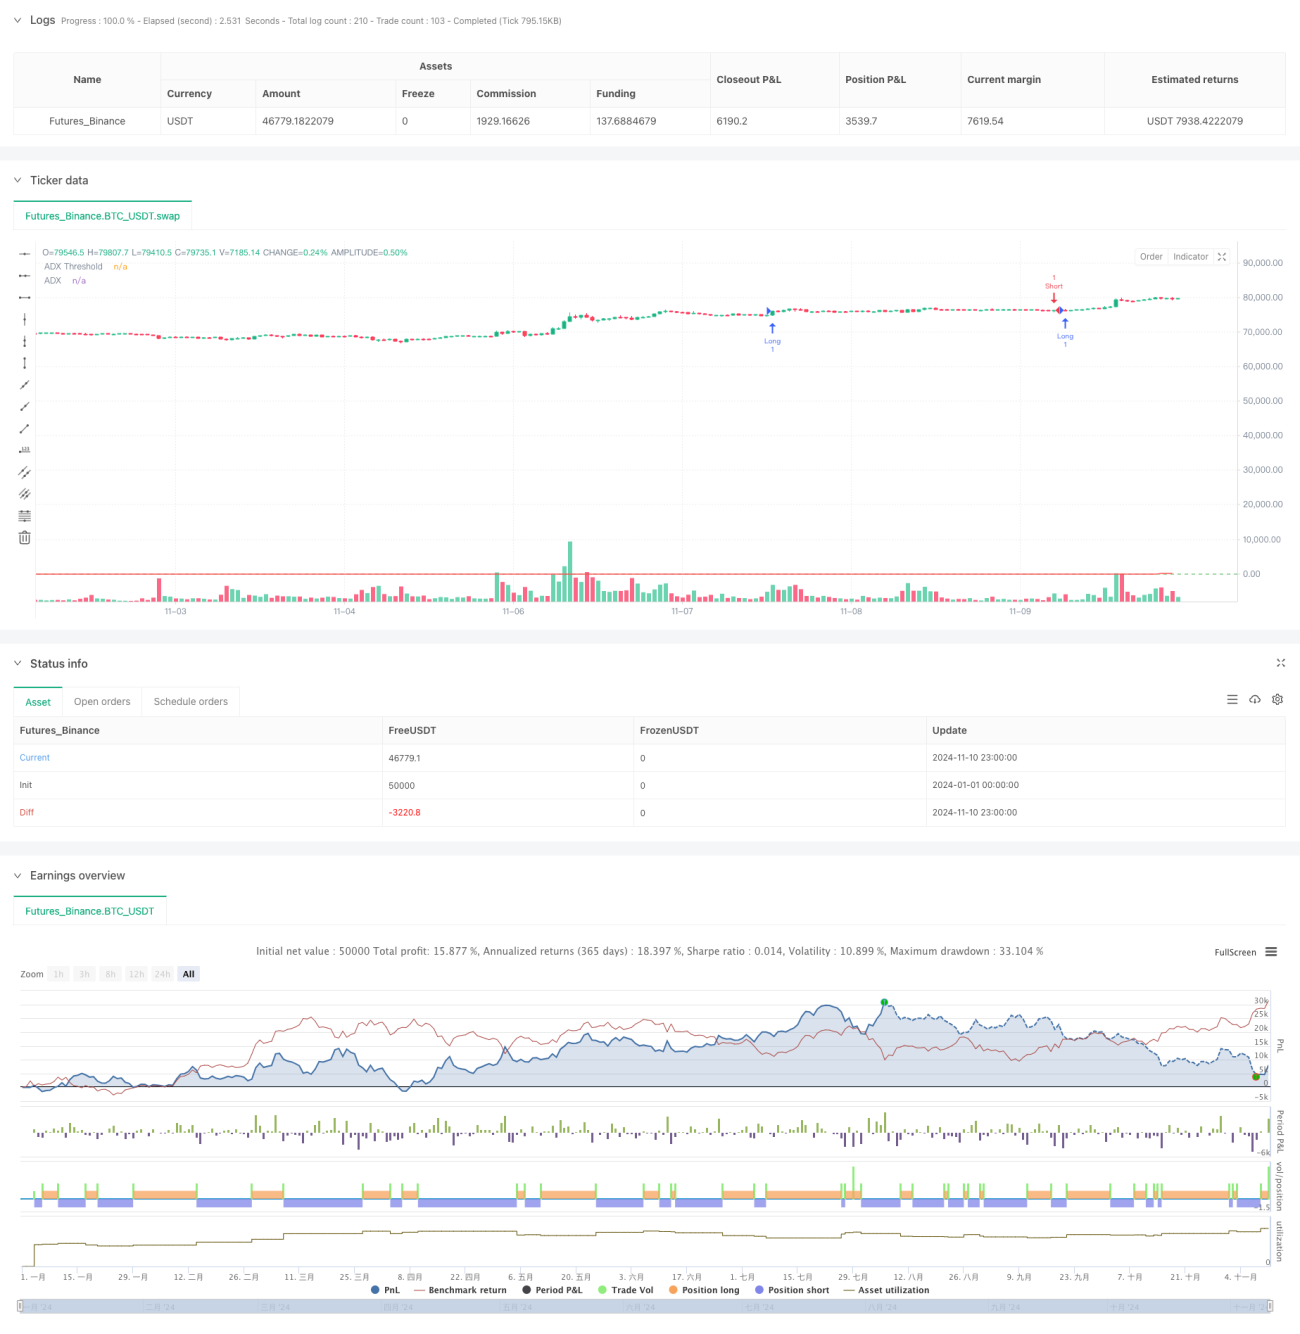
この戦略は,ADX指標と取引量に基づいたトレンド追跡システムである.これは,ADX指標を組み合わせてトレンドの強さを判断し,取引量を確認信号として使用することで,強いトレンドの市場での信頼できる取引機会を捕獲する.戦略の核心論理は,市場が明らかなトレンドを示し,十分な取引量によってサポートされている場合にのみ取引することである.
戦略原則
戦略はADX指標と取引量の二重フィルタリング機構を採用する.ADXの値が設定された<unk>値 (デフォルト26),を超えると,市場の明らかな傾向があることを示す.同時に,現在の取引量の20サイクル取引量の平均線との関係を比較して (デフォルト倍数1.8),トレンドの有効性を確認する.この2つの条件を満たす基礎で,DI+とDI-の相対的に強い関係に基づいてトレンドの方向を判断し,そうしてポジション開設の方向を決定する.逆転の信号が発生すると,戦略はリスクを制御するために自動的にポジションを平準化する.
戦略的優位性
- 双重確認メカニズムは取引信号の信頼性を大幅に高めています.
- ADX <unk>値と取引量倍数の設定により,偽信号を効果的にフィルターできます.
- 戦略の論理が明確で,パラメータが調整可能で,適応性がある.
- 自動清算機は,リスクの管理に役立つ
- トレンドの強さと市場への参加により,取引の成功率が向上する
戦略リスク
- ADXは遅滞の指標として,入場時間が遅れている可能性があります.
- 不安定な市場では誤ったシグナルが頻繁に発生する可能性がある
- 取引量に対する要求が高く,流動性の低い市場での取引機会が逃れられる
- 市場における突発的な変化が,より大きな撤退につながる可能性がある.
戦略最適化の方向性
- 価格構造分析を導入し,入場タイミングを最適化
- リスク管理能力の向上のために,ストップとモビルのストップメカニズムを追加
- 波動率指標の導入を検討し,取引量フィルタリング条件を最適化
- 適応パラメータの仕組みを開発し,戦略の適応性を向上させる
- タイムフィルタを追加し,不利なタイミングで取引を避ける
要約する
これは,構造が整った,論理が明確なトレンド追跡戦略である.ADX指標と取引量の組み合わせによる使用により,トレンド取引における信号信頼性の問題をより良く解決している.戦略のパラメータ設定は柔軟で,異なる市場特性に応じて最適化することができる.一定の遅れのリスクがあるものの,適切なパラメータ調整と最適化改進によって,この戦略は,優れた実用価値を持っている.
Source
Pine
Strategy parameters
Related strategies
Comment
All comments (0)
No data
- 1