1
フォロー
1750
フォロワー
概要
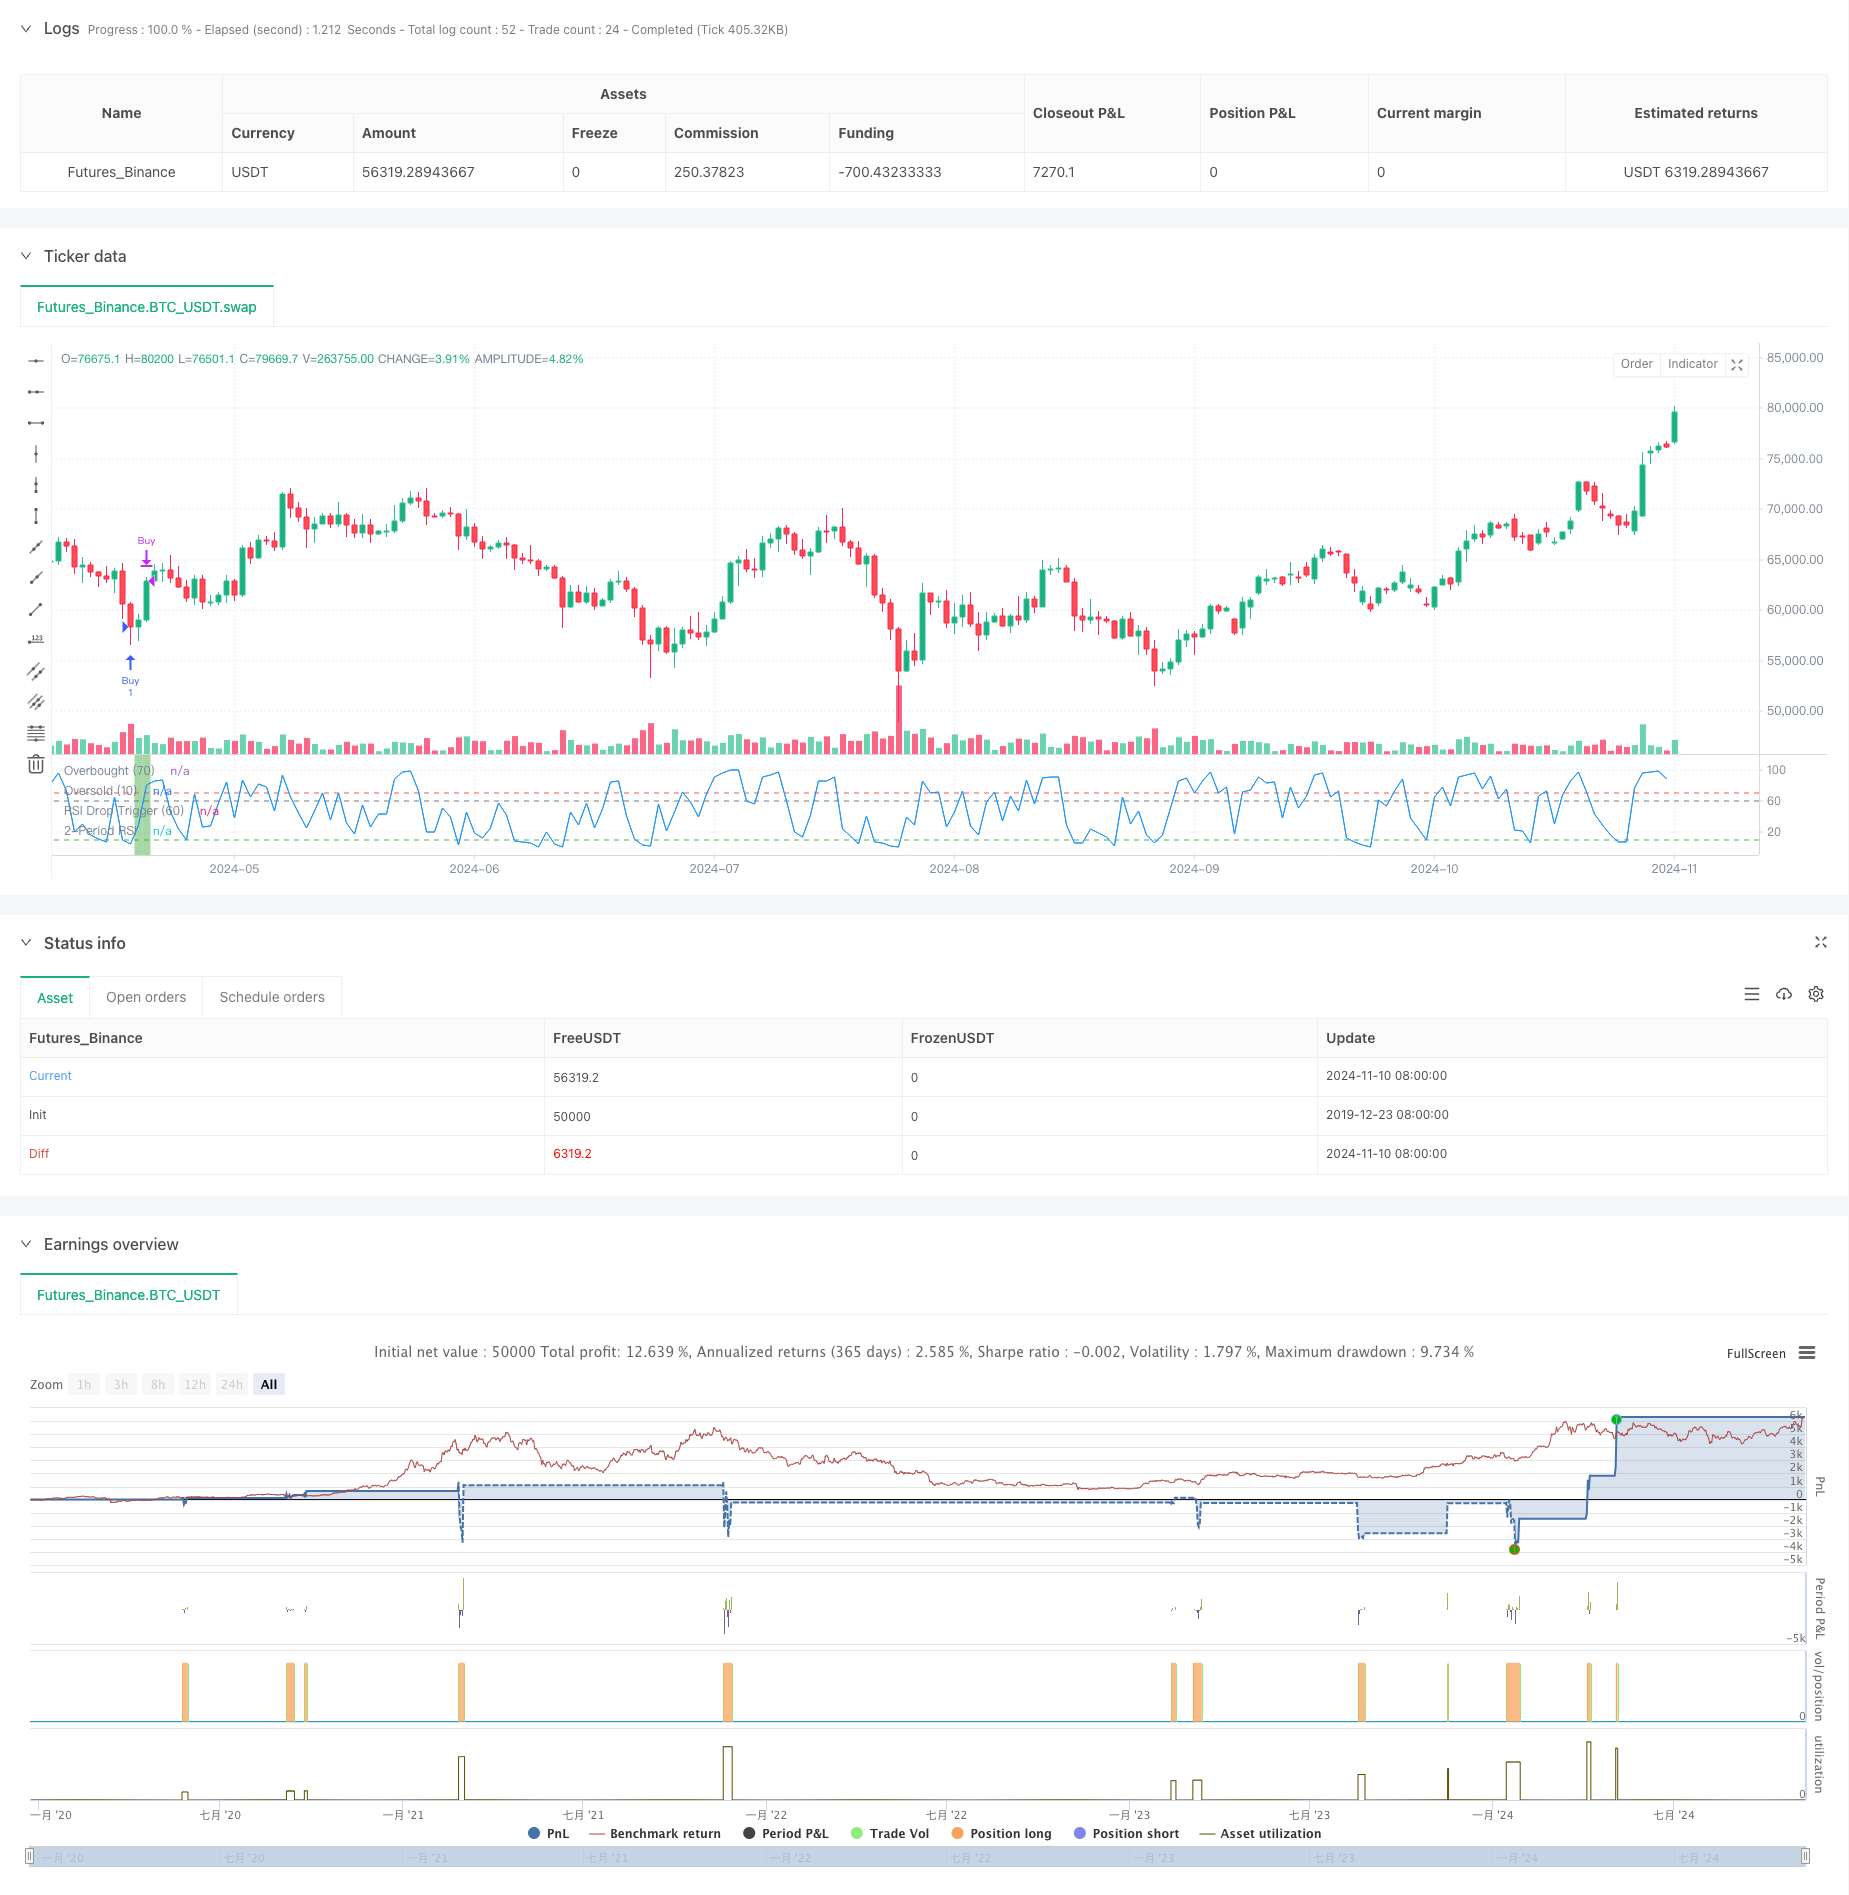
この戦略は,平均回帰理論に基づく短期取引戦略で,200日平均線と2周期RSI指標を組み合わせて取引する.戦略の核心は,長期の上昇傾向の中で超売り修正の機会を探すことであり,三重検証メカニズムによって取引信号の信頼性を確保する.
戦略原則
戦略は,取引シグナルを確認するために三重検証メカニズムを使用します. まず,価格が200日平均線上にあることを要求し,長期の上昇傾向を確認します. 次に,RSIが連続して3日間下落することで,短期オーバーセールを形成し,最初の下落はRSI60以上から開始する必要があります. 最後に,RSIが10以下まで下落して極度のオーバーセールを形成することを要求します.
戦略的優位性
- トリプル検証は取引信号の信頼性を大幅に高めています.
- 長期・短期指標を組み合わせることで,単一の指標がもたらす誤信号を回避します.
- 策略の論理が明確で,パラメータ設定がシンプルで,理解し実行しやすい.
- 均線フィルターにより,取引方向が主動トレンドと一致することを確認します.
- エクストリーム・オーバーセール条件で入場を誘発し,取引の成功率を向上させる
戦略リスク
- 頻繁に取引すると,取引コストが高くなる可能性があります.
- 強いトレンドの市場では,継続的な上昇の機会を逃す可能性があります.
- RSIは,特定の市場条件下で遅滞する可能性があります.
- 市場が激しく波動すると,偽の信号が多すぎる可能性があります. リスク管理には,ストップ・ロスを設定し,ポジション保持時間を制御し,取引頻度を最適化することが推奨されます.
戦略最適化の方向性
- 取引量指標の追加は補助的な確認として検討できる
- RSIパラメータを最適化して,異なる周期のパフォーマンスをテストする
- 市場変動に応じてパラメータを調整する適応メカニズムを導入
- トレンド強度フィルターを追加し,取引の質を向上させる
- リスク管理の最適化のための損失防止メカニズムの導入を検討する
要約する
この戦略は,均線とRSI指標の巧妙な組み合わせによって,堅牢な取引システムを構築する. 三重検証機構は,取引の信頼性を効果的に高め,しかし,リスク管理とパラメータ最適化に注意する必要がある. 戦略は全体的に合理的に設計され,優れた実用価値と最適化スペースを持っています.
ストラテジーソースコード
/*backtest
start: 2019-12-23 08:00:00
end: 2024-11-11 00:00:00
period: 1d
basePeriod: 1d
exchanges: [{"eid":"Futures_Binance","currency":"BTC_USDT"}]
*/

//@version=5
strategy("Larry Connors RSI 3 Strategy", overlay=false)

// Define the moving averages and the RSI
sma200 = ta.sma(close, 200)
rsi2 = ta.rsi(close, 2)

// Conditions for the strategy
condition1 = close > sma200  // Close above the 200-day moving average

// RSI drops three days in a row and the first day’s drop is from above 60
rsi_drop_3_days = rsi2[2] > rsi2[1] and rsi2[1] > rsi2 and rsi2[2] > 60  // The 3-day RSI drop condition
condition2 = rsi_drop_3_days

// The 2-period RSI is below 10 today
condition3 = rsi2 < 10

// Combined buy condition
buyCondition = condition1 and condition2 and condition3

// Sell condition: The 2-period RSI is above 70
sellCondition = rsi2 > 70

// Execute the buy signal when all buy conditions are met
if buyCondition
    strategy.entry("Buy", strategy.long)

// Execute the sell signal when the sell condition is met
if sellCondition
    strategy.close("Buy")

// Plotting the RSI for visual confirmation
plot(rsi2, title="2-Period RSI", color=color.blue)
hline(70, "Overbought (70)", color=color.red)
hline(10, "Oversold (10)", color=color.green)
hline(60, "RSI Drop Trigger (60)", color=color.gray)

// Set background color when a position is open
bgcolor(strategy.opentrades > 0 ? color.new(color.green, 50) : na)