
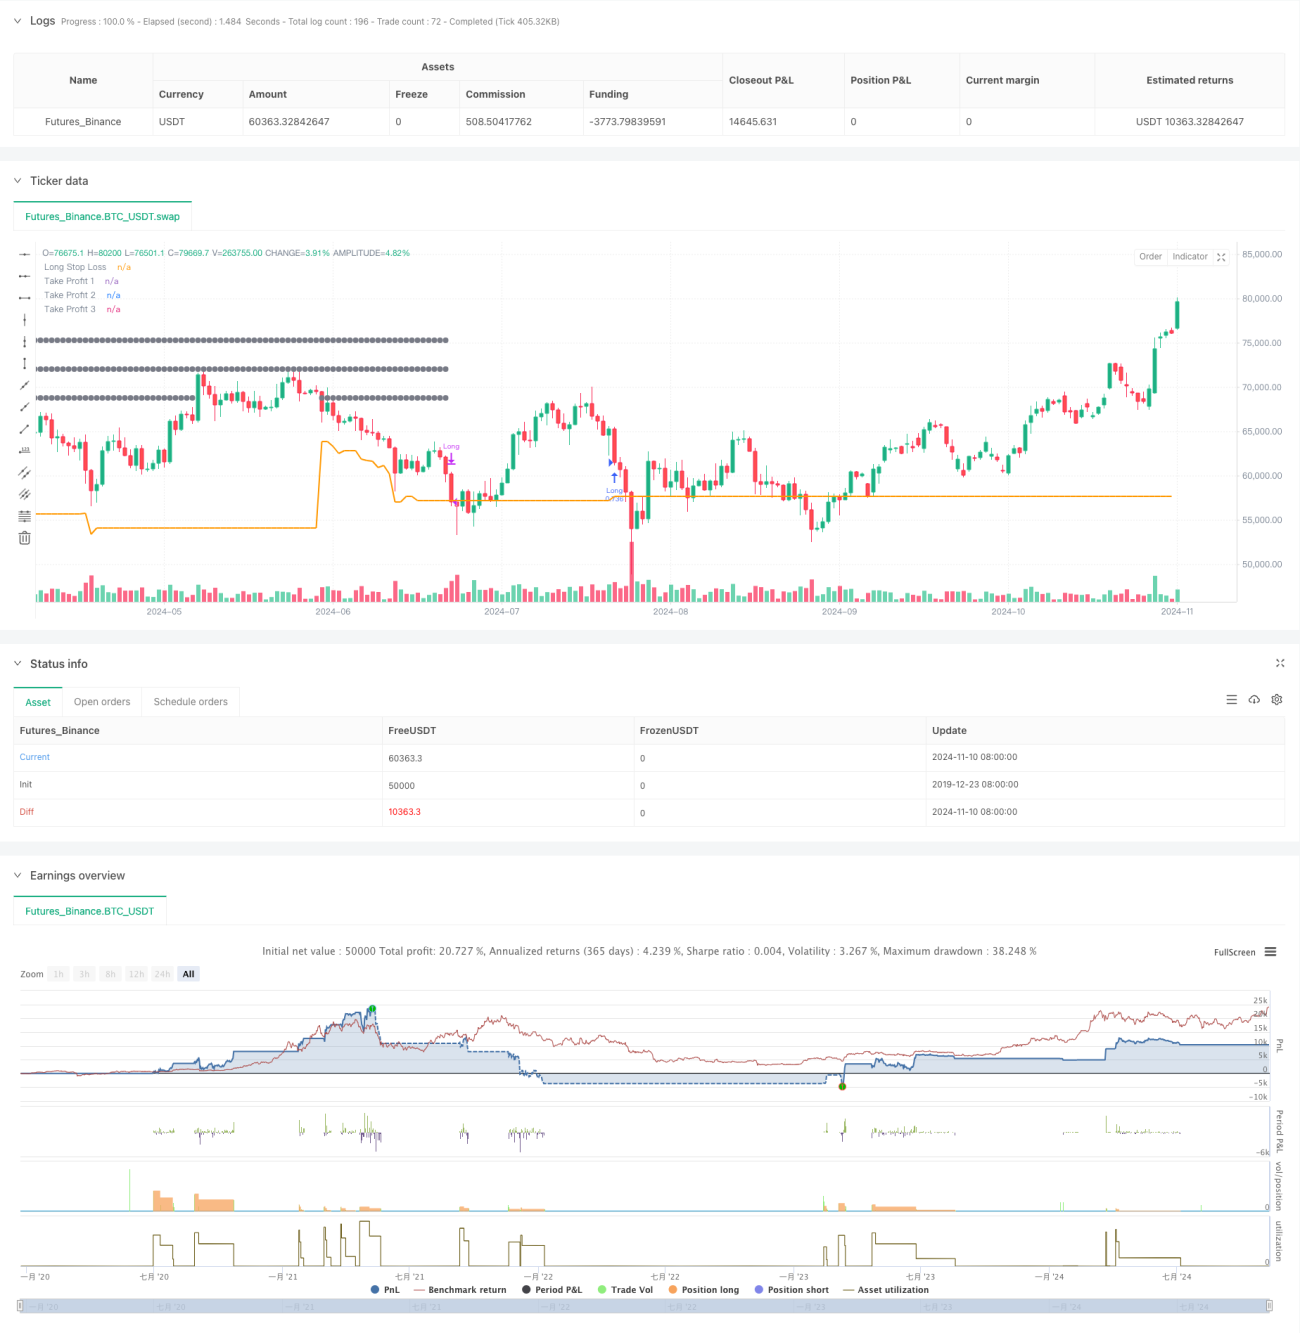
この戦略は,RSI指標に基づいたダイナミック・ストップ・ローズ・トレーディング・システムで,SMA平均線とATR波幅指標を組み合わせて取引決定を最適化する.この戦略は,ピラミッド型の平仓方式によって収益を最大化するために,多層のストップ・ローズ・スキームを採用し,同時にATRダイナミック・ストップ・ローズを使用してリスクを制御する.この戦略は,高度に自律性があり,市場の変動に応じて取引パラメータを自動的に調整することができる.
戦略は主にRSI超売り区間 ((RSI<30) を開口シグナルとして使用し,価格が200日平均線上にあることを要求し,上昇傾向にあることを保証する.システムは,トリプルストップ目標 ((5%,10%,15%) を採用し,ATRダイナミックストロップと組み合わせている.具体的には:
この戦略は,技術指標とダイナミックなリスク管理を組み合わせて,比較的完全な取引システムを構築しています.その優点は,自律性があり,リスクは制御可能ですが,実際の市場状況に応じてパラメータを最適化する必要があります.この戦略は,中長期の投資家が使用するのに適しており,システム化された取引の良い出発点です.
/*backtest
start: 2019-12-23 08:00:00
end: 2024-11-11 00:00:00
period: 1d
basePeriod: 1d
exchanges: [{"eid":"Futures_Binance","currency":"BTC_USDT"}]
*/
// This work is licensed under a Attribution-NonCommercial-ShareAlike 4.0 International (CC BY-NC-SA/4.0) https://creativecommons.org/licenses/by-nc-sa/4.0/
// © wielkieef
//@version=5
strategy("Simple RSI stock Strategy [1D] ", overlay=true, pyramiding=1, initial_capital=10000, default_qty_type=strategy.percent_of_equity, default_qty_value=75, calc_on_order_fills=false, slippage=0, commission_type=strategy.commission.percent, commission_value=0.03)
// Rsi
oversoldLevel = input(30, title="Oversold Level")
overboughtLevel = input(70, title="Overbought Level")
rsi = ta.rsi(close, 5)
rsi_overbought = rsi > overboughtLevel
rsi_oversold = rsi < oversoldLevel
// Sma 200
lenghtSMA = input(200, title = "SMA lenght")
sma200 = ta.sma(close, lenghtSMA)
// ATR stop-loss
atrLength = input.int(20, title="ATR Length")
atrMultiplier = input.float(1.5, title="ATR Multiplier")
atrValue = ta.atr(atrLength)
var float long_stop_level = na
var float short_stop_level = na
var float tp1_level = na
var float tp2_level = na
var float tp3_level = na
// Strategy entry
long = (rsi_oversold ) and close > sma200
// Take Profit levels
tp_1 = input.float(5.0, "TP 1", minval=0.1, step=0.1)
tp_2 = input.float(10.0, "TP 2", minval=0.2, step=0.1)
tp_3 = input.float(15.0, "TP 3", minval=0.3, step=0.1)
if long
strategy.entry('Long', strategy.long)
long_stop_level := close - atrMultiplier * atrValue
tp1_level := strategy.position_avg_price * (1 + tp_1 / 100)
tp2_level := strategy.position_avg_price * (1 + tp_2 / 100)
tp3_level := strategy.position_avg_price * (1 + tp_3 / 100)
// basic SL - this code is from author RafaelZioni, modified by wielkieef
sl = input.float(25.0, 'Basic Stop Loss %', step=0.1)
per(procent) =>
strategy.position_size != 0 ? math.round(procent / 100 * strategy.position_avg_price / syminfo.mintick) : float(na)
// ATR SL
if (strategy.position_size > 0 and (close <= long_stop_level))
strategy.close("Long")
tp1_level := na
tp2_level := na
tp3_level := na
plot(long_stop_level, color=color.orange, linewidth=2, title="Long Stop Loss")
// TP levels
if (strategy.position_size > 0)
if (not na(tp1_level) and close >= tp1_level)
tp1_level := na
if (not na(tp2_level) and close >= tp2_level)
tp2_level := na
if (not na(tp3_level) and close >= tp3_level)
tp3_level := na
plot(strategy.position_size > 0 and not na(tp1_level) ? tp1_level : na, color=color.gray, style=plot.style_circles , linewidth=1, title="Take Profit 1")
plot(strategy.position_size > 0 and not na(tp2_level) ? tp2_level : na, color=color.gray, style=plot.style_circles , linewidth=1, title="Take Profit 2")
plot(strategy.position_size > 0 and not na(tp3_level) ? tp3_level : na, color=color.gray, style=plot.style_circles , linewidth=1, title="Take Profit 3")
// Strategy exit points for Take Profits
strategy.exit('TP 1', from_entry="Long", qty_percent=33, profit=per(tp_1), loss=per(sl))
strategy.exit('TP 2', from_entry="Long", qty_percent=66, profit=per(tp_2), loss=per(sl))
strategy.exit('TP 3', from_entry="Long", qty_percent=100, profit=per(tp_3), loss=per(sl))
// by wielkieef