ダブル移動平均RSIトレンドモメンタム戦略

1
Follow
1781
Followers
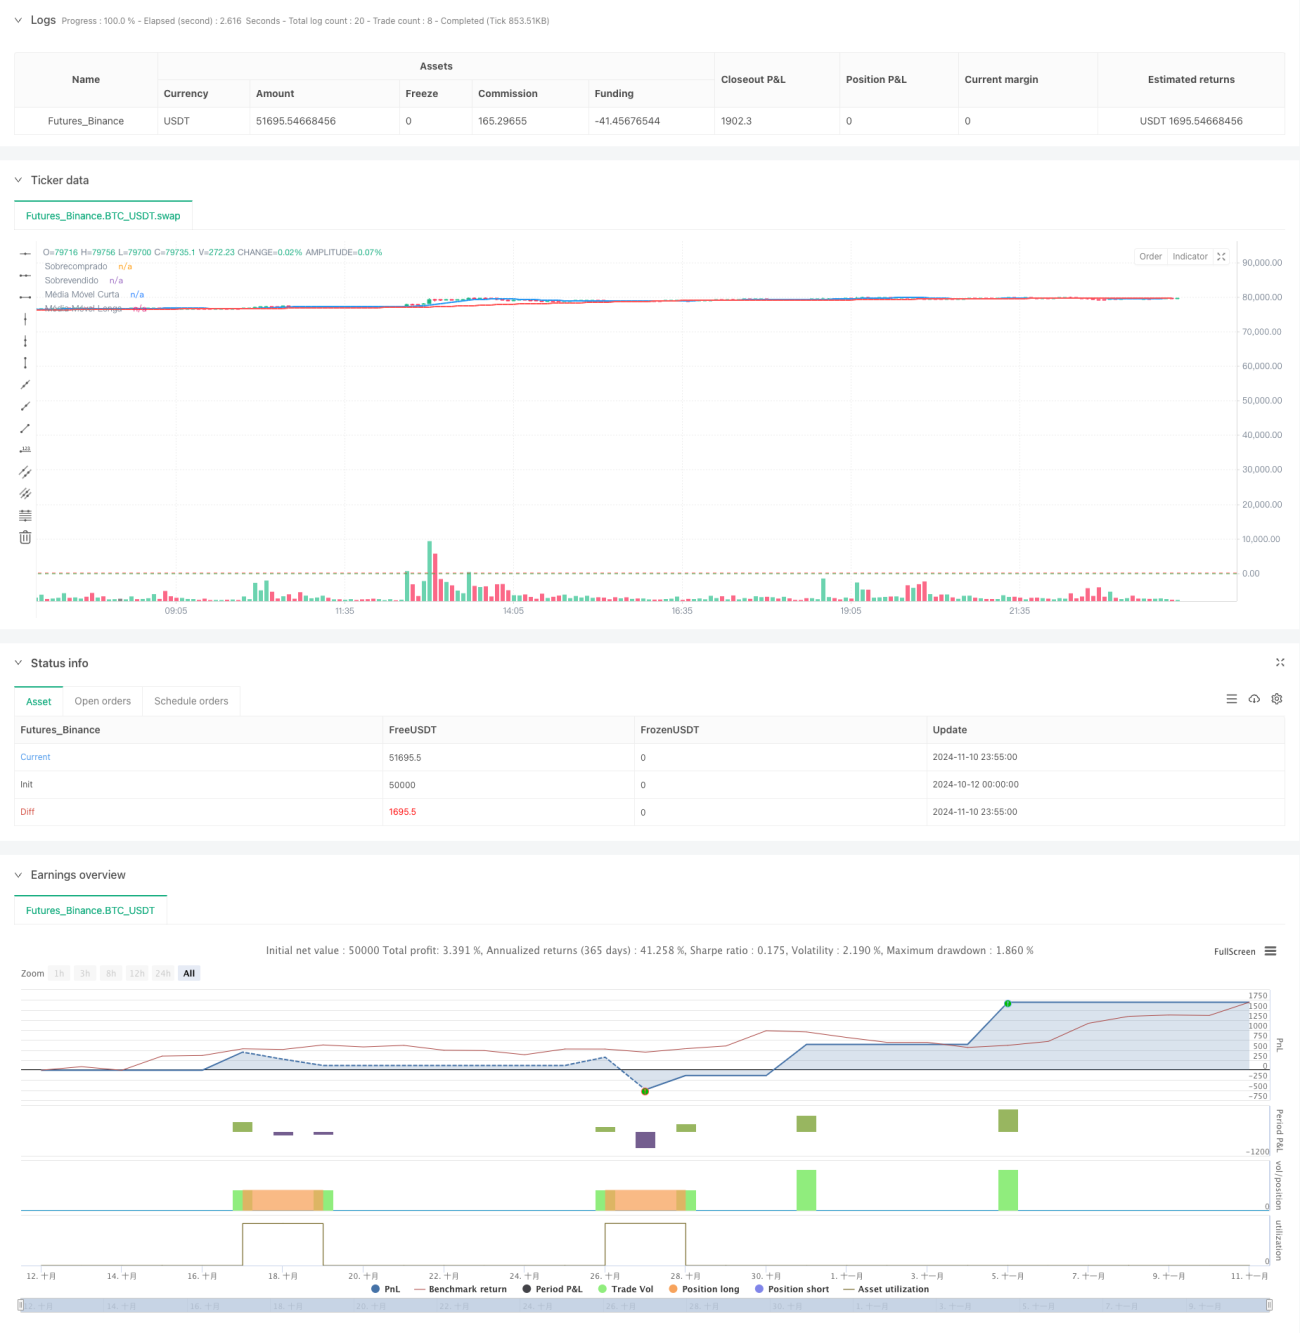
概要
この戦略は,双平均線とRSI指標を組み合わせたトレンド追跡取引システムである.戦略は,短期と長期の移動平均の交差によって市場のトレンド方向を決定し,同時,RSI指標を使用して,超買い超売り領域でよりよい入場タイミングを探し,トレンド追跡と動量の逆転の完璧な組み合わせを実現する.戦略は,パーセントの資金管理方法を採用し,各取引で総口座額の10%を投入し,リスクを効果的に制御する.
戦略原則
戦略は10周期と50周期の単純な移動平均 (SMA) を使ってトレンドを識別する.短期平均線が長期平均線を穿越し,RSIが30を下回ると,システムは多信号を発信する.短期平均線が長期平均線を穿越し,RSIが70を下回ると,システムは空き信号を発信する.平仓の側面では,RSIが70を超えると多点平になる.
戦略的優位性
- トレンドとモチベーションの二重確認により,取引成功率の向上
- リスク管理に百分率管理を活用する
- 明確な入場・出場条件を設定し,主観的な判断を避ける
- RSIの超買い超売りの特性を活用する
- 戦略ロジックは明確で、理解しやすく、実行しやすい
- 異なる市場環境に対応し,高度な適応性
戦略リスク
- 不安定な市場では誤ったシグナルが多すぎる可能性がある
- RSIは,強気なトレンドで,長期にわたって超買超売領域に留まる可能性があります.
- 双均線システムには遅滞がある.
- 固定パラメータの設定は,すべての市場環境に適していない可能性があります.
リスク管理には以下の方法が推奨されています.
- ストップ・ロスを設定する
- 動的調整パラメータ
- トレンド確認インジケーターを追加する
- 単一の取引の規模を制御する
戦略最適化の方向性
- 市場波動率の動向に応じて均線周期を調整する自適性パラメータメカニズムを導入
- 弱いトレンドでの取引を避けるため、トレンド強度フィルターを追加しました
- 資金管理システムの最適化,市場の変動に応じてポジションのサイズ調整
- 取引確認の追加技術指標
- ダイナミック・ストップ・メカニズムの開発,資金利用の効率化
要約する
これは,トレンドを追跡し,動力の逆転を完璧に組み合わせた定量取引戦略である. 双平線によってトレンドの方向を判断し,RSIを使用して最適な入場点を探すことで,取引の方向の正確さを保証し,価格が上昇または下落するときに間に間に合うように利益を得ることができます. 戦略の成功の鍵は,パラメータの合理的な設定とリスクの有効な管理にあります. 継続的な最適化と改善により,戦略は,異なる市場環境で安定した利益を得ることが期待されています.
Source
Pine
Strategy parameters
Related strategies
Comment
All comments (0)
No data
- 1