複数移動平均モメンタムトレンドフォロー戦略

1
Follow
1781
Followers
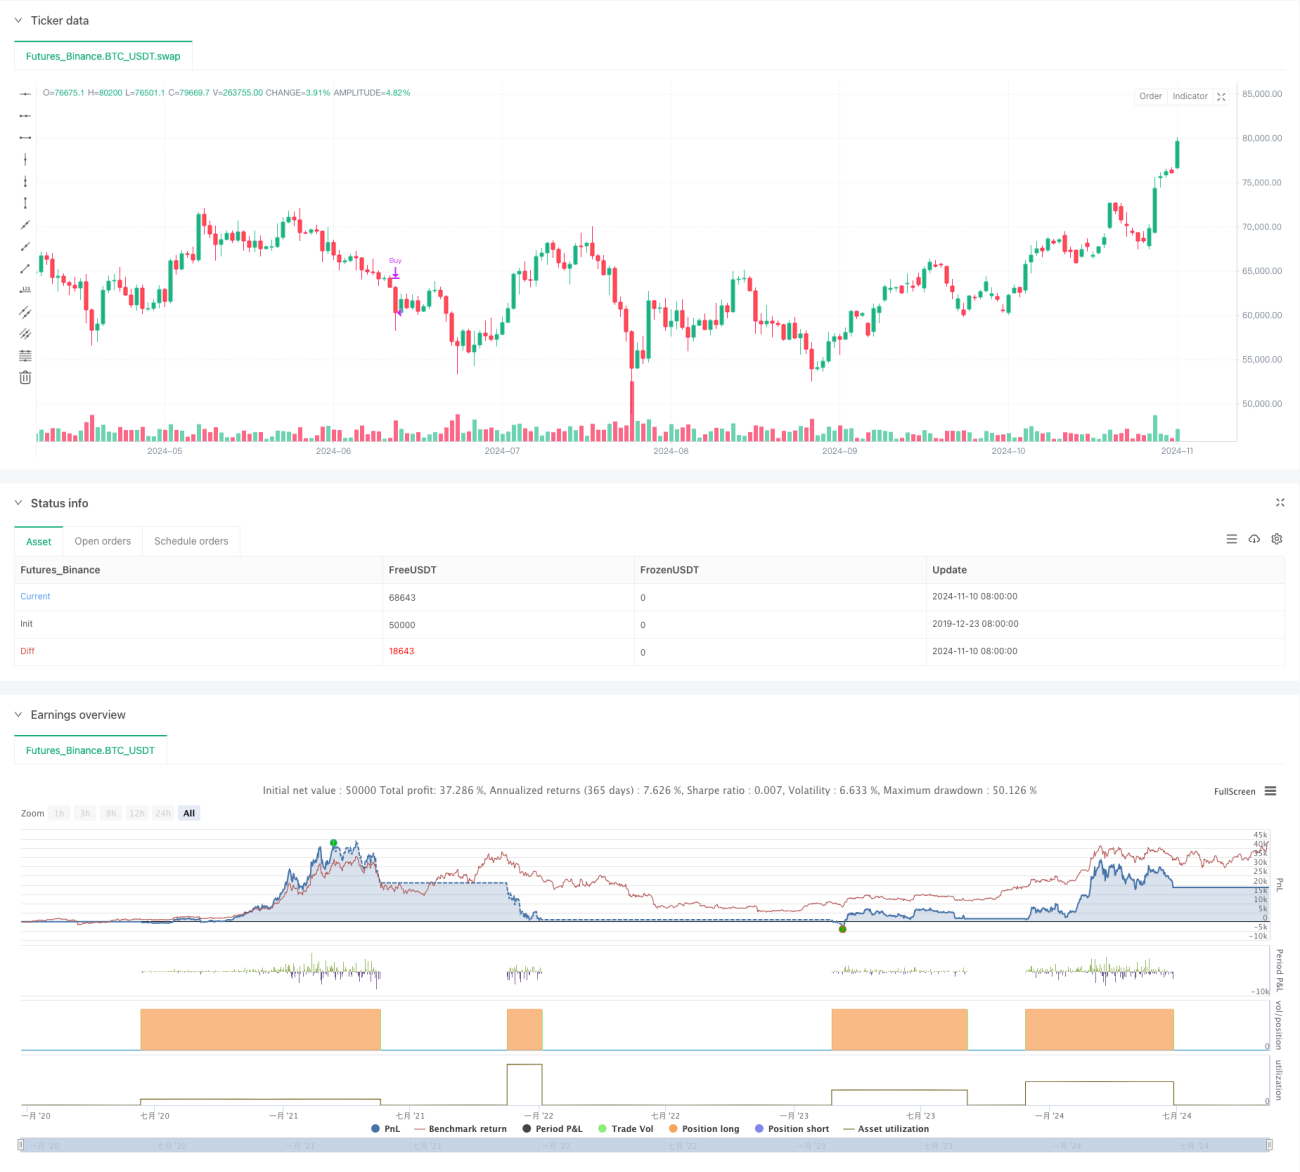
概要
この戦略は,複数の平均線と動向指標に基づいたトレンド追跡取引システムである.この戦略は,20日,50日,150日,200日SMAのダイナミックな関係を主に利用し,交差量とRSIの指標を組み合わせて,日線レベルで強い上昇傾向を捕捉し,トレンドが弱くなったときにタイミングで平衡を保つ.この戦略は,複数の技術指標の組み合わせを使用して,偽信号を効果的にフィルターし,取引の正確性を向上させる.
戦略原則
戦略の核心的な論理には以下の重要な部分が含まれています.
- 均線システム: 20/50/150/200日均線を用いてトレンド判断システムを構築し,多均線が多頭並列であることを要求する.
- 動力の確認:RSI指数とその移動平均を用いて価格の動きを判断し,RSIが55以上またはRSISMAが50以上でRSIが上昇することを要求する.
- 取引量検証:取引量の20日平均線と最近の取引量との比較によって,買い売りシグナルの有効性を確認する.
- トレンドの継続性確認:過去40日間の取引のうち少なくとも25日間で50日平均線が上昇傾向にあることを確認する.
- ポジション確認:価格が150日平均線上には少なくとも20取引日以上安定する必要がある.
購入条件は以下の通りです.
- 最近10日のうち4日以上は日光が照らされ,1日以上は放量された
- RSIは動量条件を満たしている
- 均線系は多頭並びで上昇しています.
- 価格が150日平均線以上で安定している
販売条件は以下の通りです.
- 価格が150日平均を下回った
- 連続した放出量減少
- 50日平均線は150日平均線から下がった.
- 最近は陰線が多く,交差量が増加している.
戦略的優位性
- 複数の技術指標のクロス検証により,誤判率を低減
- トレンド持続性の要求は厳格で,短期的な変動をフィルタリングできます.
- 交差量分析を組み合わせ,信号の信頼性を向上させる
- 明確なストップ・ストップ条件とリスクの管理
- 中長期のトレンドを捉え,取引頻度を減らすのに適しています.
- 戦略ロジックは明確で、理解しやすく、実行しやすい
戦略リスク
- 平均線は後退し,トレンドの初期段階を逃す可能性があります.
- 厳格な入場条件により,一部の取引機会を逃す可能性があります.
- 不安定な市場では誤ったシグナルが頻繁に発生する可能性がある
- 市場逆転の認識には遅延がある
- 撤収には大きな資金が必要
リスク管理の提案:
- 合理的なストップポジションを設定する
- 資金管理は控えめで
- トレンド確認の指標を増やすことを検討する
- 市場環境によるパラメータの調整
戦略最適化の方向性
- 適応パラメータを追加する
- 市場変動率の動向に合わせて平均線周期を調整する
- RSI <unk>値設定を最適化する
- 損失を抑える仕組みの改善
- 追跡停止を追加する
- 設定時間停止
- 市場環境分析を導入する
- トレンド強度指数増加
- 波動率の指標を考慮する
- 取引規模を最適化する
- 動的ポジション管理を設計する
- 信号の強度に応じて調整する
要約する
これは,複数の技術指標の配合による設計された厳格なトレンド追跡戦略であり,強力なトレンドの機会を効果的に捉えることができます. 戦略の主要な優点は,完全な信号確認機構と厳格なリスク管理システムにあります.
Source
Pine
Related strategies
Comment
All comments (0)
No data
- 1