マルチ期間RSIモメンタムとトリプルEMAトレンドフォロー複合戦略

1
Follow
1789
Followers
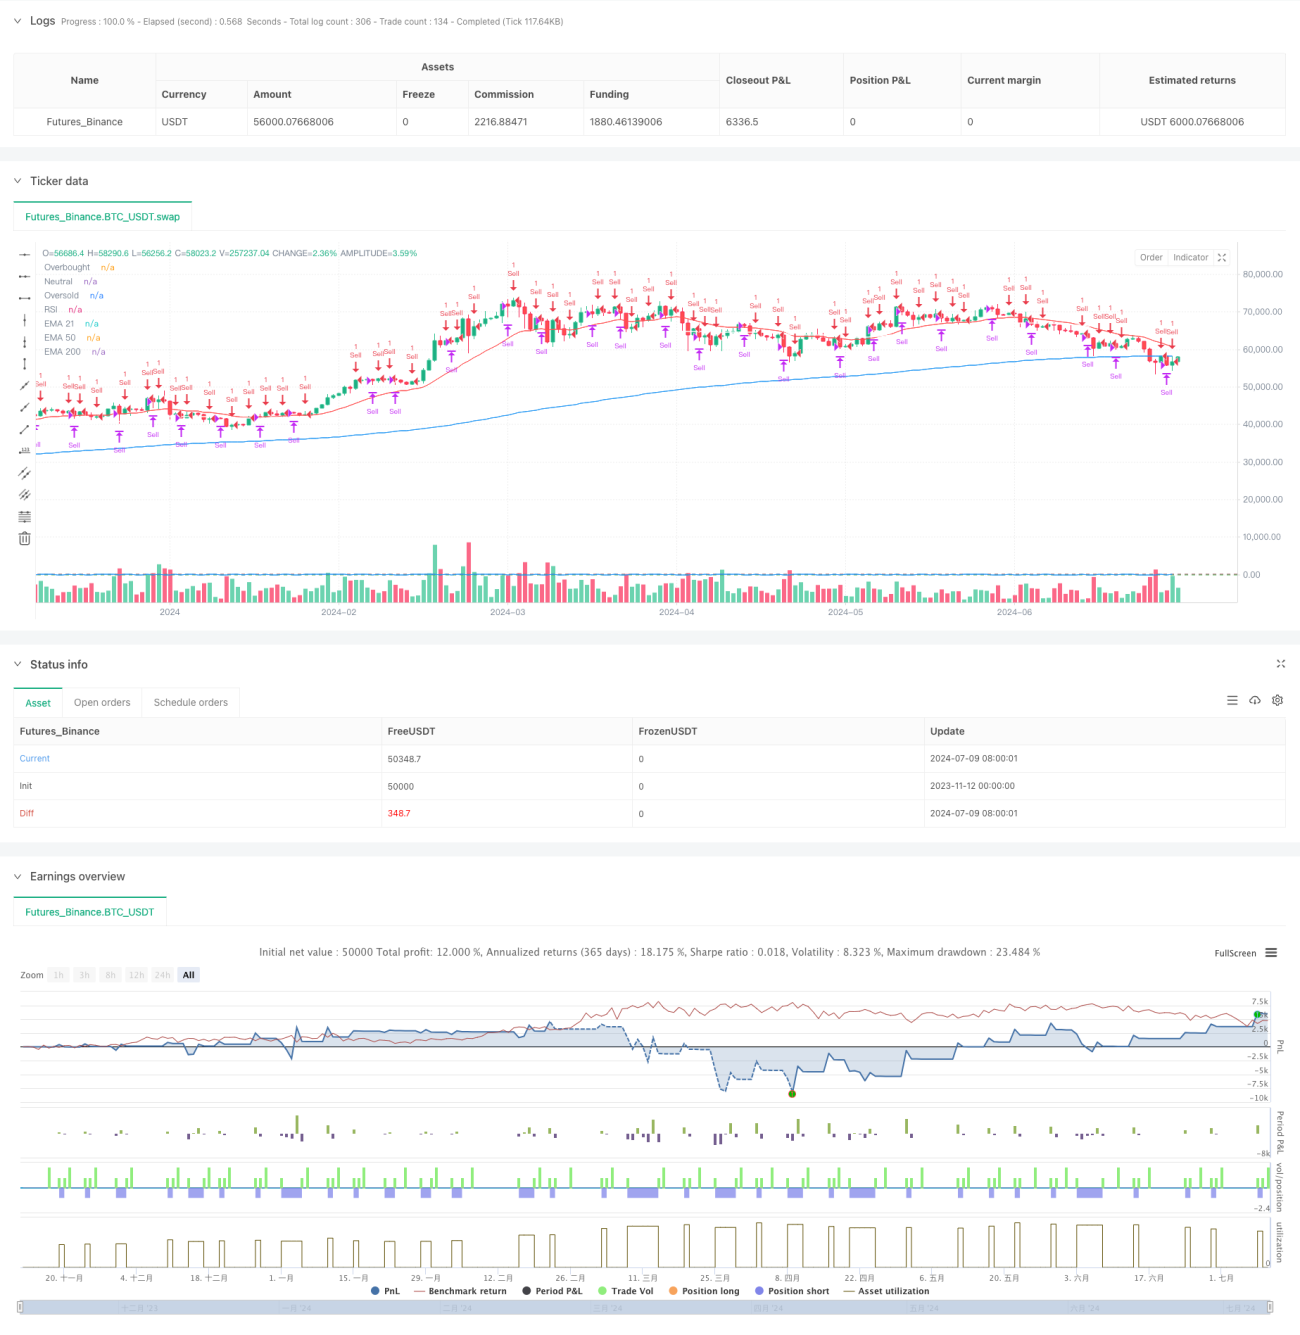
概要
この戦略は,動態指標RSIとトレンド指標EMAを組み合わせた複合型取引システムである.これは,1分と5分の2つの時間周期で動作し,RSIの超買超売シグナルとトリプルEMAのトレンド判断によって取引決定を行う.この戦略は,トレンド追跡と均等回帰の両方の特性を含み,異なる市場環境下での取引機会を捉えることができる.
戦略原則
策略は21/50/200日の三重EMAをトレンド判断基準として採用し,改良版のRSI指標 (チェビシェフ方法による計算) と組み合わせて,市場の超買超売状態を識別する. 1分周期で,RSIが94を突破すると,空売りを開始し,4時平仓を打破し,RSIが50に戻ると,保安ストップを設定する. 5分周期で,価格が200日EMAを突破して反発すると,多額の開拓が行われ,RSIが超買または下落すると中値平仓する. 策略は,ポジション管理変数 inLongPositionおよび inPositionShort を使って,再入場を避ける.
戦略的優位性
- 複数の時間周期分析により信号の信頼性が向上
- トレンドとモナビリティの組み合わせで互いを補完する利点
- リスク管理のための保安ストップメカニズム
- 改善されたRSI計算方法により,信号はより正確です.
- ポジション管理により重複取引を避ける
- 異なる市場環境に対応できる
戦略リスク
- 頻繁に取引すると手数料が高くなります.
- 市場が激しく波動する時に頻繁にストップを起こす可能性
- RSIは,特定の市場条件下で偽信号を発する可能性があります.
- 多周期策略は,信号確認に遅れがある可能性がある
- EMAの交差信号は,揺れ動いている市場において誤導的かもしれない.
戦略最適化の方向性
- 波動率フィルターを導入し,高波動期間のパラメータを調整する
- 取引量確認メカニズムの追加
- RSIの限界を最適化し,動的調整を考慮する
- 複数の技術指標を追加し,クロス検証
- 適応パラメータメカニズムの導入
- 詳細な損失防止装置を開発する
要約する
この戦略は,複数の技術指標と複数の時間周期分析を組み合わせて取引の安定性と信頼性を向上させる.一定のリスクがあるものの,合理的なポジション管理とストップダスのメカニズムによってリスクの有効な制御を実現することができる.戦略の最適化スペースは大きく,より多くの技術指標と最適化パラメータを導入することによって戦略のパフォーマンスをさらに向上させることができる.
Source
Pine
Strategy parameters
Related strategies
Comment
All comments (0)
No data
- 1