
1
Follow
1781
Followers
概要
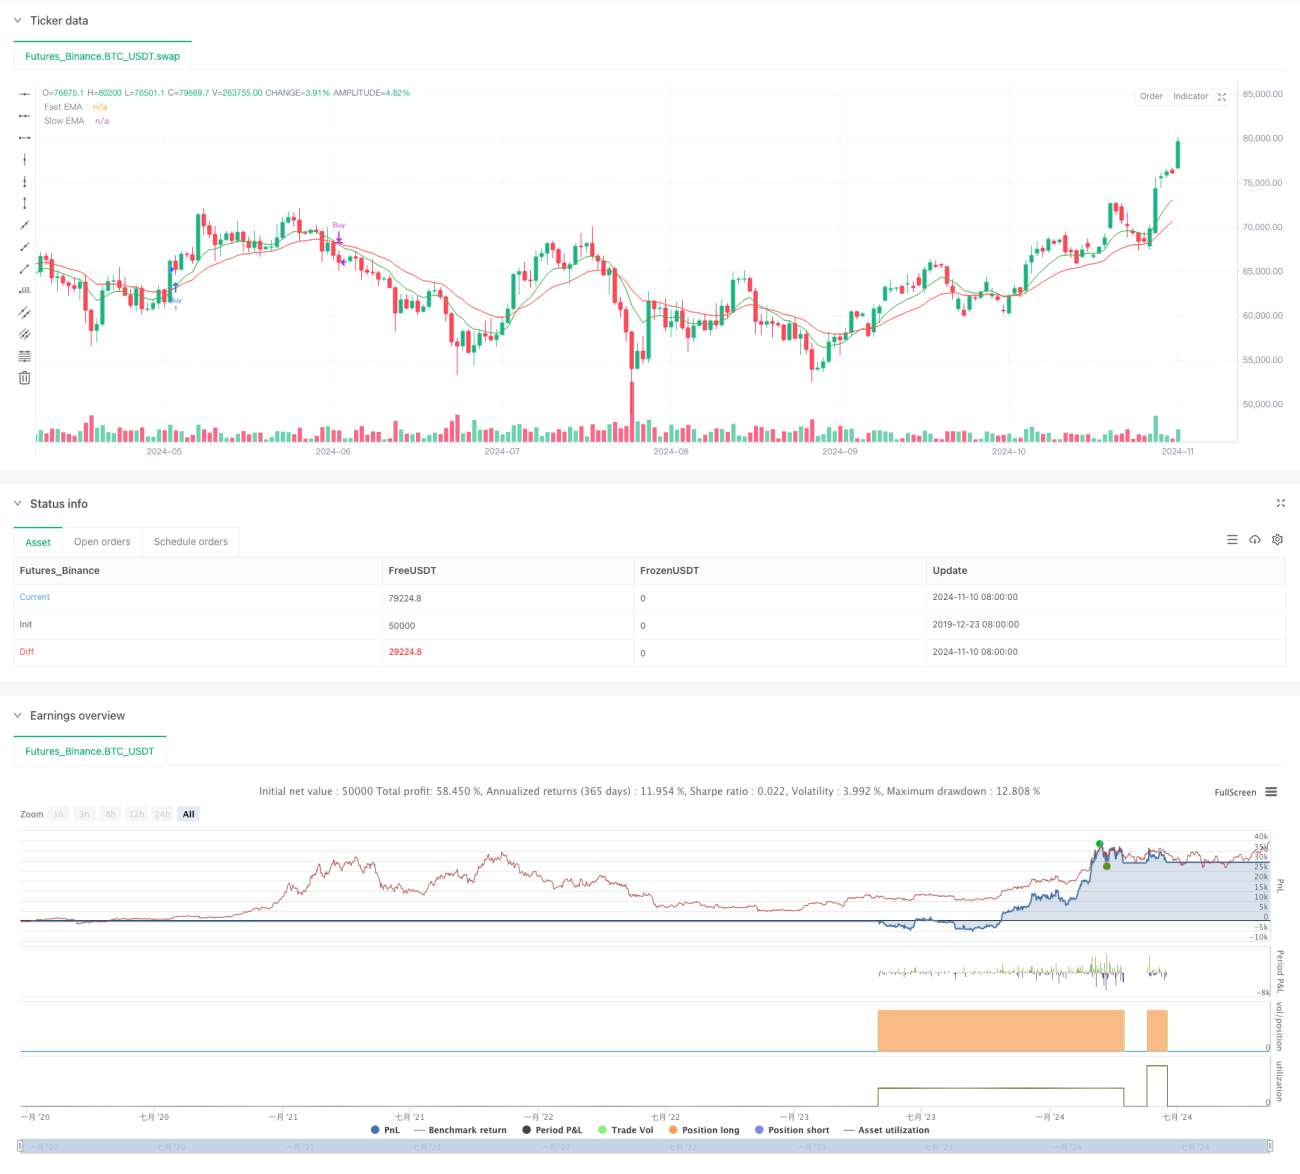
この戦略は,指数移動平均 ((EMA),相対的に強い指標 ((RSI) と平均トレンド指標 ((ADX) の3つの技術指標を統合した,複数の技術指標に基づいた量化取引システムである.この戦略は,EMAの高速・遅い線の交差信号を主要な入場根拠として使用し,RSIの指標と組み合わせて,過買買の確認を行い,ADXの指標を使用して市場の傾向の強さを判断し,完全な取引意思決定システムを形成する.この戦略には,リスク管理モジュールが含まれ,リスクと利益の比率を設定することで,各取引のストップとストップポジションを制御する.
戦略原則
戦略の核心的な論理は,以下の重要な要素に基づいています.
- 9周期と21周期のEMAを主要信号システムとして使用し,快線上を横切ってスローラインを横切って買い信号を生じ,快線下を横切ってスローラインを横切って売り信号を生成する
- RSIをフィルターとして導入し,買取信号はRSIが60以下である必要があり,超買取区域での入場を避ける.売出信号はRSIが40以上である必要があり,超売り区域での平仓を避ける.
- ADX指標を使用してトレンドの強さを確認し,ADXが20を超えるとのみ取引を行い,明確なトレンドにエントリーすることを保証します.
- 資金管理では,ストップ・ロスの設定は,2.0のリスク/利益比で実行されます.
戦略的優位性
- 複数の技術指標の統合により,信号の信頼性が向上し,偽信号の影響を軽減します.
- EMAの交差点は,トレンドの転換点を効果的に捉える
- RSI フィルターは,極域での不利な入場を効果的に回避します.
- ADXの導入は,明確なトレンドでのみ取引を保証し,勝利率を高めました.
- 固定リスク・利益比設定は,長期にわたる安定した資金成長に貢献します.
- 戦略は,取引シグナルのマークと価格タグを含む明確なグラフィックインタフェースを設計した
戦略リスク
- 複数の指標が信号の遅延を引き起こし,入場時刻に影響を与える可能性がある
- 変動する市場では,頻繁に交差信号が生じ,取引コストが増加する可能性があります.
- 固定RSIとADXの<unk>値は,すべての市場環境に適用されない可能性があります.
- 想定されるリスク/利益の比率は,すべての市場段階に適していない可能性があります.
- 信号の信頼性を影響する通信量要因を考慮しない
戦略最適化の方向性
- 市場変動の動態に応じてEMAサイクルを調整する自己適応の指標パラメータを導入する
- 信号の信頼性を向上させるために音量確認メカニズムを追加
- RSIとADXの動的な<unk>値を開発し,異なる市場環境に対応する
- 市場変動の動向に合わせて調整されたリスク/利益の比率
- タイムフィルターを追加し,不利なタイミングで取引を避ける
- 市場環境認識モジュールを追加し,異なる市場状態で異なるパラメータ設定を使用
要約する
これは,合理的で論理的に設計された複数の技術指標の取引戦略である.EMA,RSI,ADXの3つのクラシック技術指標を統合することによって,戦略はトレンド追跡とリスク管理の面で良好なパフォーマンスを発揮している.いくつかの最適化が必要な場所があるが,全体的にこの戦略は,優れた実用価値と拡張スペースを持っています.
Source
Pine
Strategy parameters
Related strategies
Comment
All comments (0)
No data
- 1