移動平均フィルターシステムと組み合わせた適応型トレンドモメンタムRSI戦略

1
Follow
1780
Followers
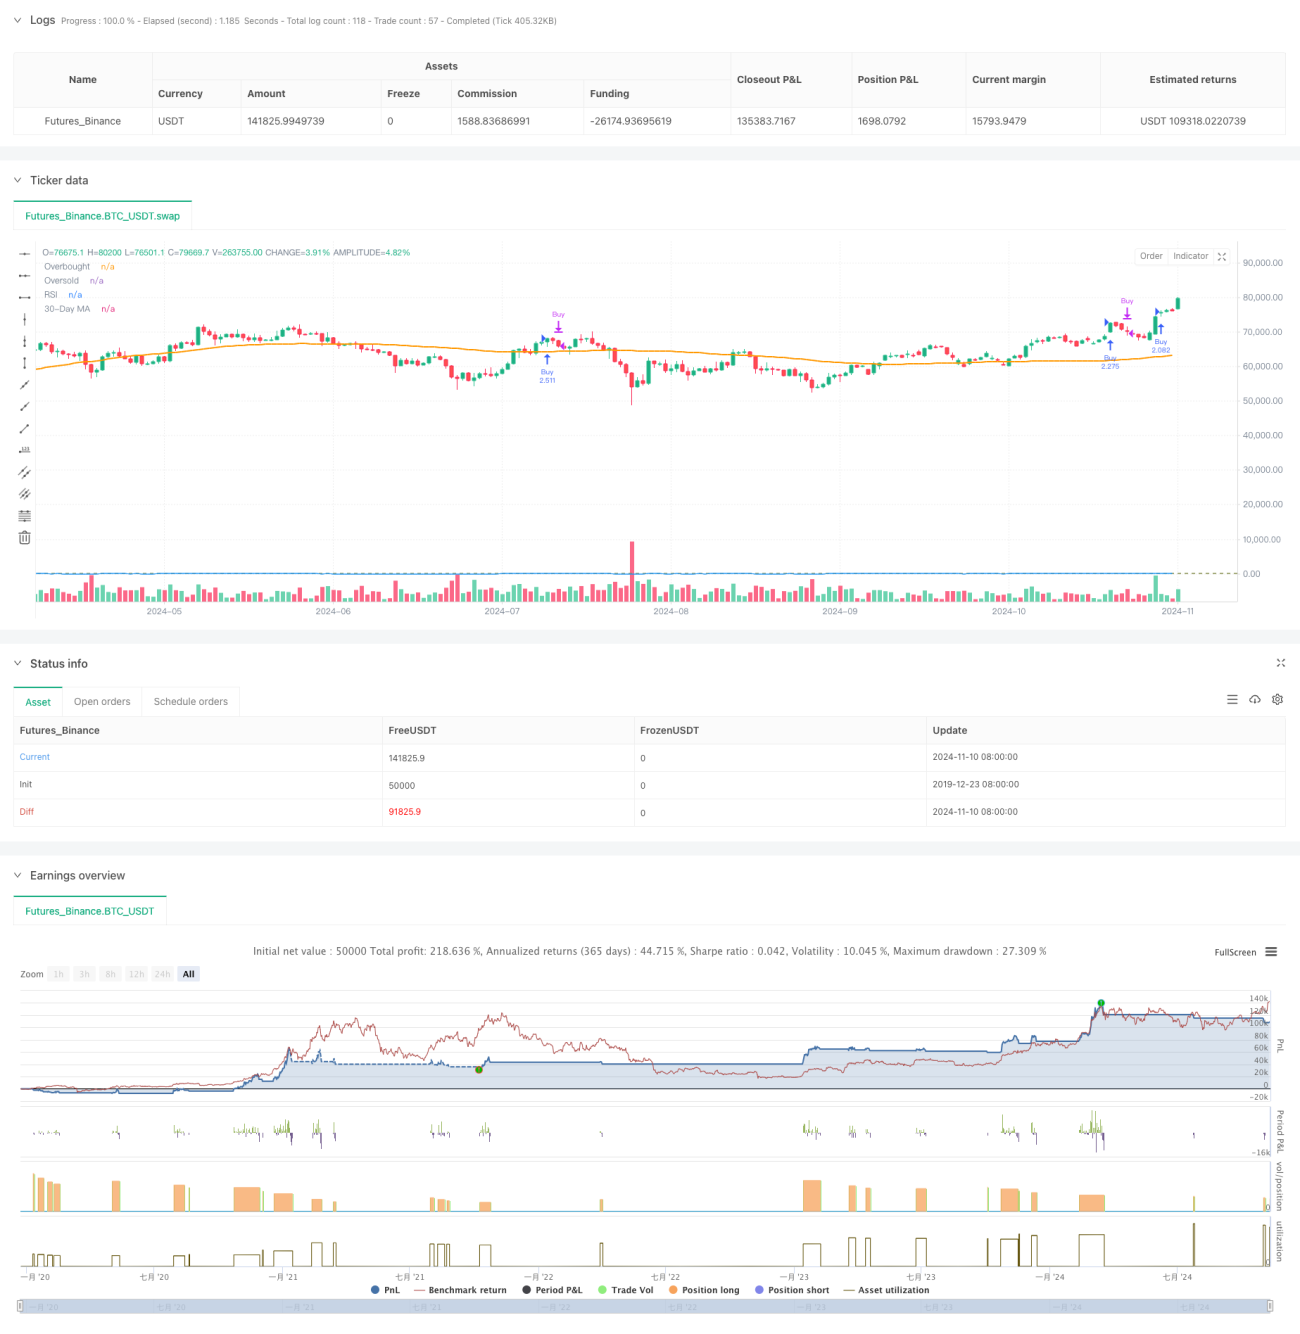
概要
この戦略は,相対的に強い指標 ((RSI) と移動平均 ((MA) を組み合わせたトレンド追跡取引システムである.戦略の核心は,RSI指標を通じて価格動量の変化を捉え,90日移動平均をトレンドフィルターとして組み合わせて,市場動向を効果的に追跡することを可能にします.戦略は,調整可能なRSIを用い,超買い超売り<unk>値を超え,戦略の実用性と安定性を確保するために2500日の反測期間を設定します.
戦略原則
この戦略は、次のコアコンポーネントに基づいています。
- RSI指数設定: 12サイクルRSIを使用し,70と62を超買超売り<unk>値として設定することで市場の動きを捉えます.
- 移動平均:90日移動平均をトレンド確認指標として使用する.
- ポジション管理:多重シグナルが発生すると,システムは,現在のアカウントの権利益に基づいて,開設ポジションの数を自動的に計算する.
- タイムウィンドウ:戦略が合理的な時間枠内で実行されるようにするために,2500日間の追及期限を導入します.
買い条件のトリガーは,RSI値が70を超えるときに発生し,売る信号はRSI値が62を超えるときに発生する. システムは,開設条件を満たし,有効なリターン期間内にいる場合,自動計算し,全仓開設操作を実行する.
戦略的優位性
- ダイナミックな適応性: 調整可能なRSI<unk>値により,戦略は異なる市場環境に適応できます.
- リスク管理の改善:RSIと均線の二重確認を組み合わせて,偽突破のリスクを低減
- ポジション管理の科学:口座権益に基づくダイナミックなポジション管理で,資金利用の効率性を確保
- タイムウィンドウは合理的な:2500日の追及期限制は,過去データに過度に適合しない
- ビジュアル化サポート: 戦略は,監視と調整を容易にするために,RSIと均等線のリアルタイムビジュアル化を提供します.
戦略リスク
- トレンドの逆転リスク:波動の激しい市場では偽のブレイクが起こりうる
- 参数感性:RSIと平均線周期の選択は,戦略のパフォーマンスに大きな影響を与える
- スリップポイント影響:流動性が不足した場合,全仓運用がスリップポイントリスクにさらされる
- 回測期間制:固定回測期は,いくつかの歴史パターンを逃す可能性がある
リスク管理の提案:
- RSIの<unk>値の調整は,市場特有の動向によって推奨される.
- リスク管理の強化のための Stop Loss Stop 機能を追加する
- スライドポイントの影響を軽減するために,分量に貯蔵庫を建設することを検討する.
- パラメータの有効性を定期的に評価する
戦略最適化の方向性
-
信号システムの最適化:
- 追加された技術指標
- 交差量分析の導入により信号の信頼性が向上
-
ポジション管理の最適化:
- バッチでポジションを構築および削減するメカニズムを実装する
- ダイナミック・ストップ・ダメージ・ストップ機能を追加
-
リスク管理の最適化:
- ボラティリティ適応メカニズムの導入
- 市場環境分析モジュールを追加
-
観測システムの最適化:
- 統計指標を追加する
- 自動パラメータ最適化機能を実現
要約する
この戦略は,RSI動態指標と均線トレンドフィルターを組み合わせて,比較的完ぺきな取引システムを構築している.戦略の優点は,その適応性が強く,リスク管理が完ぺきであることにあるが,パラメータの感受性や市場環境の変化による影響をまだ注意する必要がある.提案された最適化の方向によって,戦略には,さらに安定性と収益性を向上させる大きな改善の余地がある.
Source
Pine
Strategy parameters
Related strategies
Comment
All comments (0)
No data
- 1