
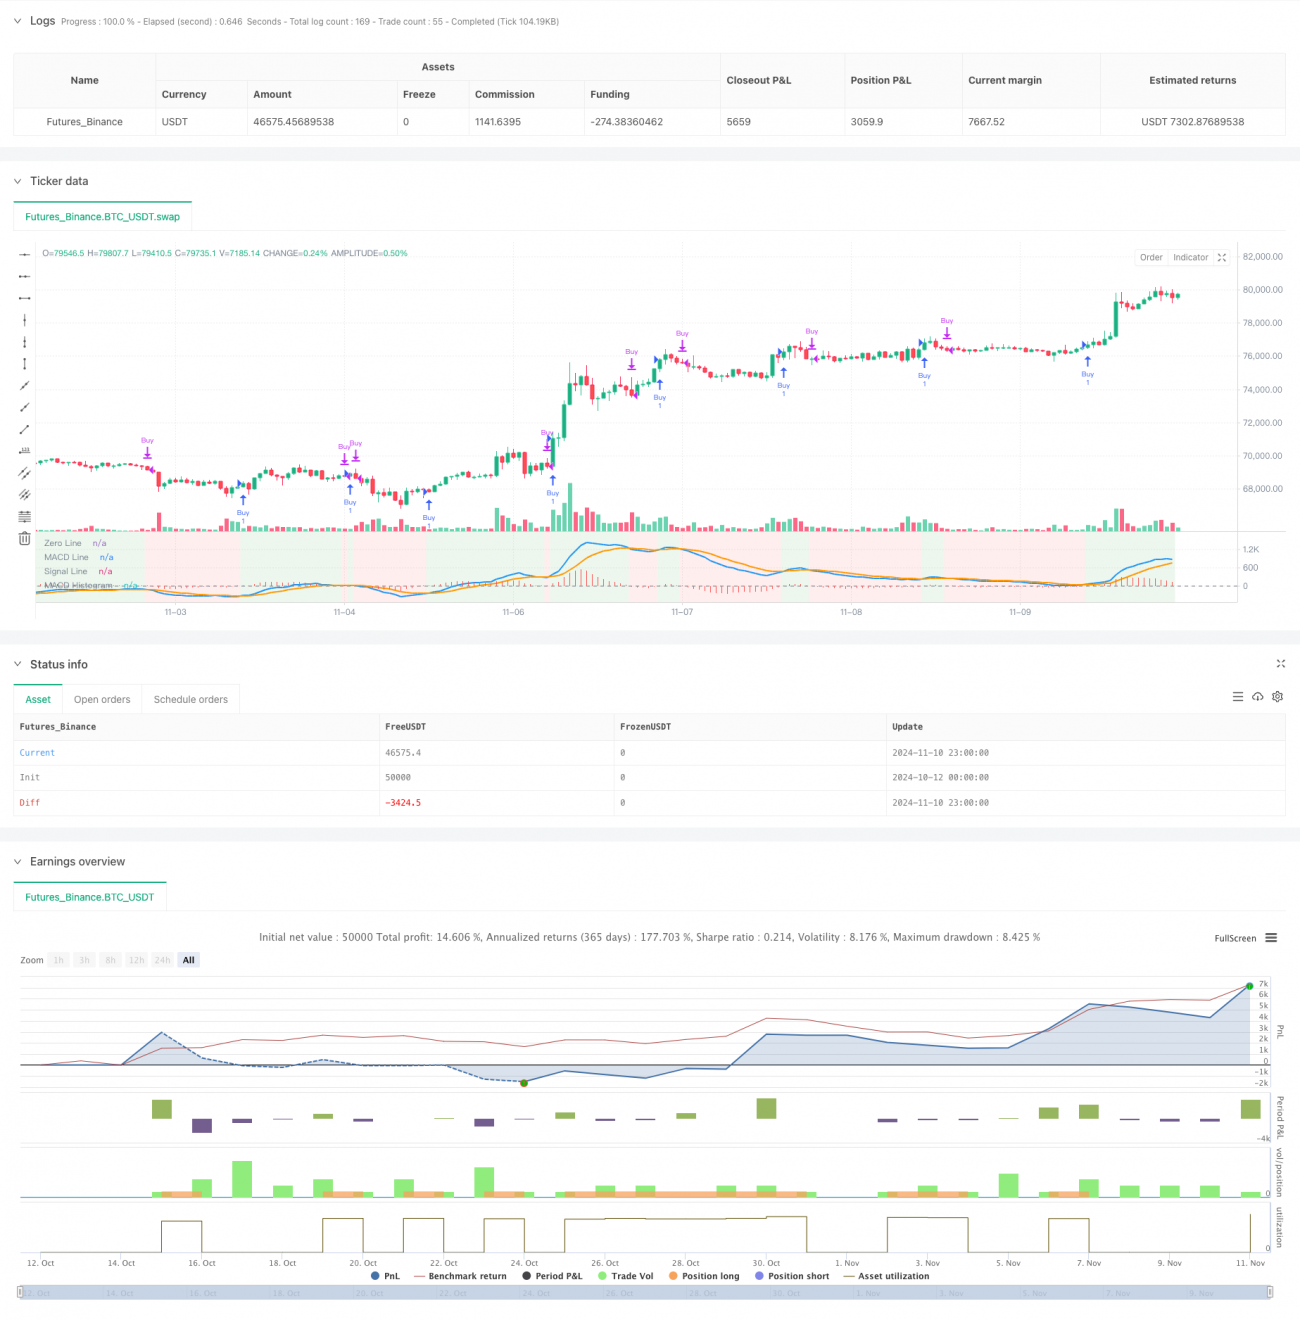
この戦略は,MACD (移動平均収束散乱指数) に基づく高度な量化取引システムで,ダイナミックな背景表示と複数の既定のパラメータの組み合わせによって取引決定の正確性を強化しています.この戦略の核心は,MACD指数の交差信号によって市場のトレンドの転換点を捕捉し,視覚的な方法で市場の空白状態を直感的に表示することです.
戦略は,異なる市場環境と取引スタイルに適応するために,標準設定 ((12,26,9),短期 ((5,35,5),長期 ((19,39,9) などを含む10種類の異なるMACDパラメータの既定を採用している. MACDラインとシグナルラインが金色の交差したとき,システムは買入シグナルを生成し,死亡交差したとき,システムは販売を生成する. 信号戦略は,ダイナミックな背景の色変化 ((緑色は多頭,赤色は空頭) を介して視覚的認識を強化し,トレーダーが市場動向をよりよく把握するのを助ける.
これは,構造が整った,論理が明確なMACD戦略の進捗版である.多パラメータの設定と動的視覚フィードバックにより,戦略の実用性と操作性が大きく向上している.いくつかの固有のリスクがあるものの,提供された最適化方向による改善により,この戦略は,健全な取引システムになる見込みがある.トレーダーは,実用化される前に十分なフィードバックを行い,特定の市場環境に応じて適切なパラメータ設定を選択することを推奨している.
/*backtest
start: 2024-10-12 00:00:00
end: 2024-11-11 00:00:00
period: 1h
basePeriod: 1h
exchanges: [{"eid":"Futures_Binance","currency":"BTC_USDT"}]
*/
//@version=5
strategy("Hanzo - Top 10 MACD Strategy", overlay=false) // MACD in a separate pane
// Define dropdown options for MACD settings
macdOption = input.string(title="Select MACD Setting",
defval="Standard (12, 26, 9)",
options=["Standard (12, 26, 9)",
"Short-Term (5, 35, 5)",
"Long-Term (19, 39, 9)",
"Scalping (3, 10, 16)",
"Cryptocurrency (20, 50, 9)",
"Forex (8, 17, 9)",
"Conservative (24, 52, 18)",
"Trend-Following (7, 28, 7)",
"Swing Trading (5, 15, 5)",
"Contrarian (15, 35, 5)"])
// MACD setting based on user selection
var int fastLength = 12
var int slowLength = 26
var int signalLength = 9
switch macdOption
"Standard (12, 26, 9)" =>
fastLength := 12
slowLength := 26
signalLength := 9
"Short-Term (5, 35, 5)" =>
fastLength := 5
slowLength := 35
signalLength := 5
"Long-Term (19, 39, 9)" =>
fastLength := 19
slowLength := 39
signalLength := 9
"Scalping (3, 10, 16)" =>
fastLength := 3
slowLength := 10
signalLength := 16
"Cryptocurrency (20, 50, 9)" =>
fastLength := 20
slowLength := 50
signalLength := 9
"Forex (8, 17, 9)" =>
fastLength := 8
slowLength := 17
signalLength := 9
"Conservative (24, 52, 18)" =>
fastLength := 24
slowLength := 52
signalLength := 18
"Trend-Following (7, 28, 7)" =>
fastLength := 7
slowLength := 28
signalLength := 7
"Swing Trading (5, 15, 5)" =>
fastLength := 5
slowLength := 15
signalLength := 5
"Contrarian (15, 35, 5)" =>
fastLength := 15
slowLength := 35
signalLength := 5
// MACD Calculation
[macdLine, signalLine, _] = ta.macd(close, fastLength, slowLength, signalLength)
macdHist = macdLine - signalLine
// Buy and Sell conditions based on MACD crossovers
enterLong = ta.crossover(macdLine, signalLine)
exitLong = ta.crossunder(macdLine, signalLine)
// Execute buy and sell orders with price labels in the comments
if (enterLong)
strategy.entry("Buy", strategy.long, comment="Buy at " + str.tostring(close, "#.##"))
if (exitLong)
strategy.close("Buy", comment="Sell at " + str.tostring(close, "#.##"))
// Plot the signal price using plotchar for buy/sell prices
//plotchar(enterLong ? close : na, location=location.belowbar, color=color.green, size=size.small, title="Buy Price", offset=0)
//plotchar(exitLong ? close : na, location=location.abovebar, color=color.red, size=size.small, title="Sell Price", offset=0)
// Background highlighting based on bullish or bearish MACD
isBullish = macdLine > signalLine
isBearish = macdLine < signalLine
// Change background to green for bullish periods and red for bearish periods
bgcolor(isBullish ? color.new(color.green, 90) : na, title="Bullish Background")
bgcolor(isBearish ? color.new(color.red, 90) : na, title="Bearish Background")
// Plot the MACD and Signal line in a separate pane
plot(macdLine, title="MACD Line", color=color.blue, linewidth=2)
plot(signalLine, title="Signal Line", color=color.orange, linewidth=2)
hline(0, "Zero Line", color=color.gray)
plot(macdHist, title="MACD Histogram", style=plot.style_histogram, color=color.red)