
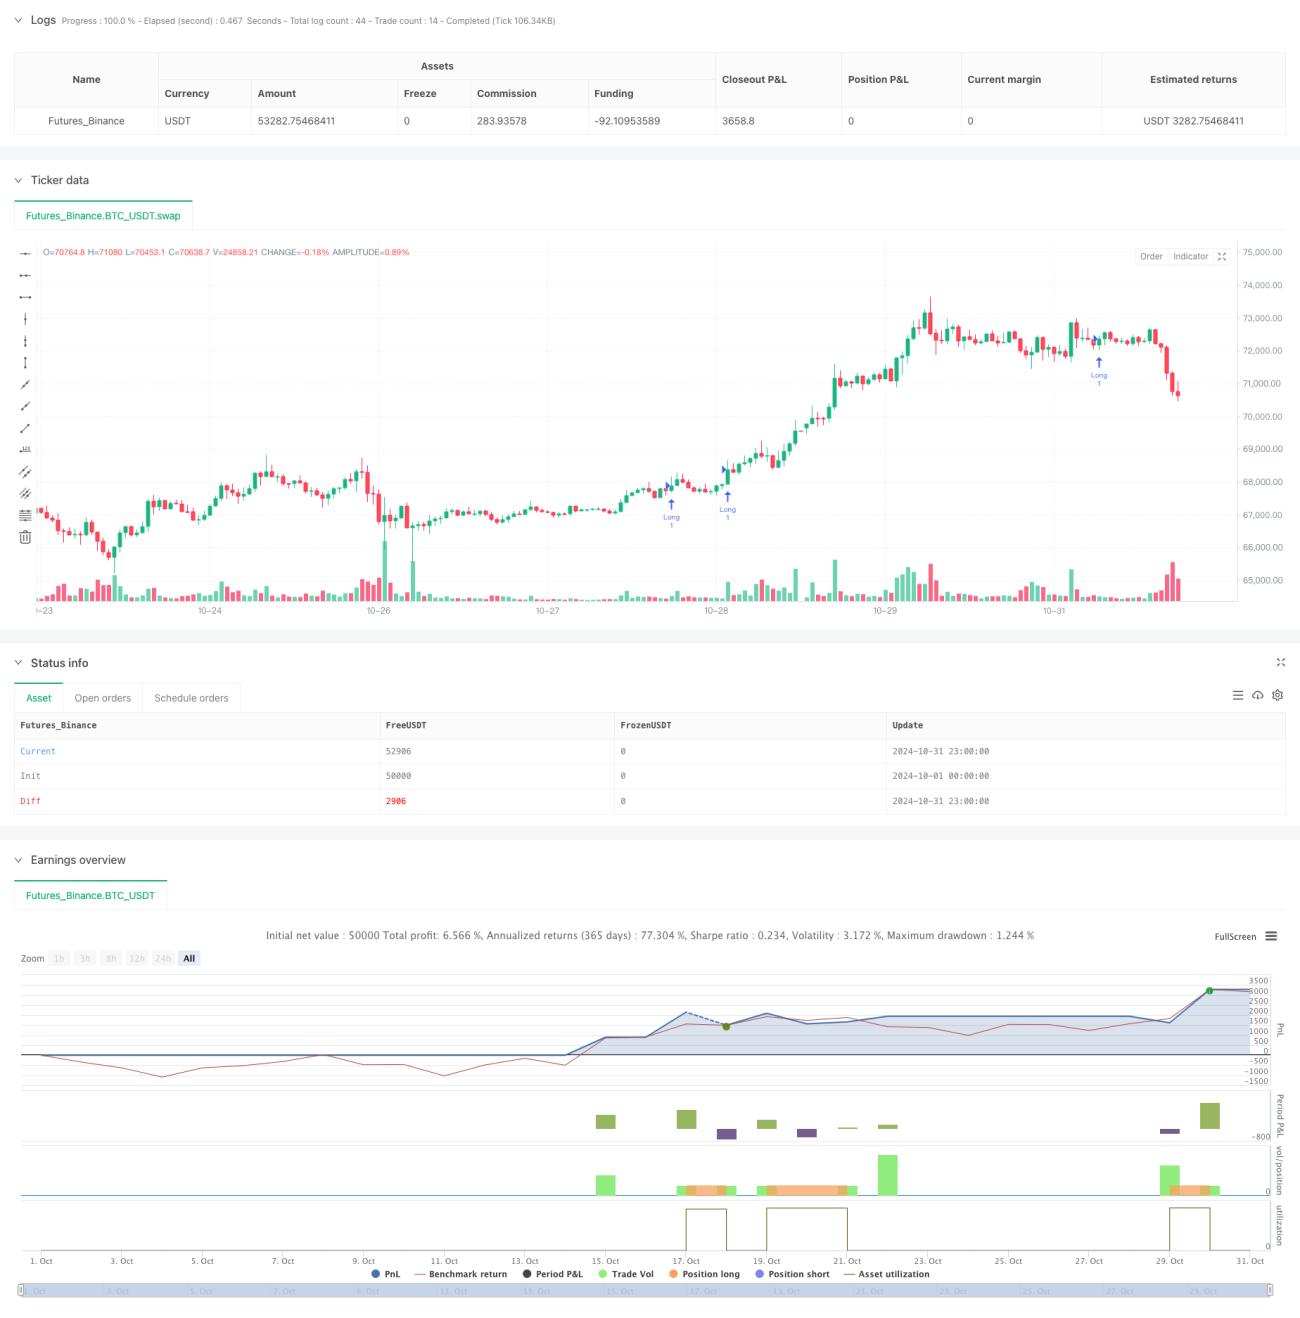
これは,多周期平均線トレンドの追跡と動量分析を組み合わせた定量化取引戦略である.戦略は,主に,20,50,100,および200日指数移動平均 ((EMA)) の配列組み合わせを分析し,日線と周線の動量指標を組み合わせて取引する.戦略は,ATRのストップロスを採用し,EMAが動量条件を満たしたときに入場し,ATRの倍数のストップと利益目標を設定することによってリスクを管理する.
戦略の中核となるロジックには、次の主要な部分が含まれます。
これは合理的で論理的に厳格に設計されたトレンド追跡戦略である.複数の技術指標の組み合わせによる使用は,戦略の安定性を保証するとともに,優れたリスク管理機構を提供している.戦略のカスタマイズ性が強く,異なる市場の特徴に応じて最適化することができる.いくつかの固有のリスクがあるものの,推奨された最適化の方向によって戦略のパフォーマンスをさらに向上させることができる.全体的に,これは試す価値のある,深く研究された量化取引戦略である.
/*backtest
start: 2024-10-01 00:00:00
end: 2024-10-31 23:59:59
period: 1h
basePeriod: 1h
exchanges: [{"eid":"Futures_Binance","currency":"BTC_USDT"}]
*/
//@version=5
strategy("Swing Trading with EMA Alignment and Custom Momentum", overlay=true)
// User inputs for customization
atrLength = input.int(14, title="ATR Length", minval=1)
atrMultiplierSL = input.float(1.5, title="Stop-Loss Multiplier (ATR)", minval=0.1) // Stop-loss at 1.5x ATR
atrMultiplierTP = input.float(3.0, title="Take-Profit Multiplier (ATR)", minval=0.1) // Take-profit at 3x ATR
pullbackRangePercent = input.float(1.0, title="Pullback Range (%)", minval=0.1) // 1% range for pullback around 20 EMA
lengthKC = input.int(20, title="Length for Keltner Channels (Momentum Calculation)", minval=1)
// EMA settings
ema20 = ta.ema(close, 20)
ema50 = ta.ema(close, 50)
ema100 = ta.ema(close, 100)
ema200 = ta.ema(close, 200)
// ATR calculation
atrValue = ta.atr(atrLength)
// Custom Momentum Calculation based on Linear Regression for Daily Timeframe
highestHighKC = ta.highest(high, lengthKC)
lowestLowKC = ta.lowest(low, lengthKC)
smaCloseKC = ta.sma(close, lengthKC)
// Manually calculate the average of highest high and lowest low
averageKC = (highestHighKC + lowestLowKC) / 2
// Calculate daily momentum using linear regression
dailyMomentum = ta.linreg(close - (averageKC + smaCloseKC) / 2, lengthKC, 0) // Custom daily momentum calculation
// Fetch weekly data for momentum calculation using request.security()
[weeklyHigh, weeklyLow, weeklyClose] = request.security(syminfo.tickerid, "W", [high, low, close])
// Calculate weekly momentum using linear regression on weekly timeframe
weeklyHighestHighKC = ta.highest(weeklyHigh, lengthKC)
weeklyLowestLowKC = ta.lowest(weeklyLow, lengthKC)
weeklySmaCloseKC = ta.sma(weeklyClose, lengthKC)
weeklyAverageKC = (weeklyHighestHighKC + weeklyLowestLowKC) / 2
weeklyMomentum = ta.linreg(weeklyClose - (weeklyAverageKC + weeklySmaCloseKC) / 2, lengthKC, 0) // Custom weekly momentum calculation
// EMA alignment condition (20 EMA > 50 EMA > 100 EMA > 200 EMA)
emaAligned = ema20 > ema50 and ema50 > ema100 and ema100 > ema200
// Momentum increasing condition (daily and weekly momentum is positive and increasing)
dailyMomentumIncreasing = dailyMomentum > 0 and dailyMomentum > dailyMomentum[1] //and dailyMomentum[1] > dailyMomentum[2]
weeklyMomentumIncreasing = weeklyMomentum > 0 and weeklyMomentum > weeklyMomentum[1] //and weeklyMomentum[1] > weeklyMomentum[2]
// Redefine Pullback condition: price within 1% range of the 20 EMA
upperPullbackRange = ema20 * (1 + pullbackRangePercent / 100)
lowerPullbackRange = ema20 * (1 - pullbackRangePercent / 100)
pullbackToEma20 = (close <= upperPullbackRange) and (close >= lowerPullbackRange)
// Entry condition: EMA alignment and momentum increasing on both daily and weekly timeframes
longCondition = emaAligned and dailyMomentumIncreasing and weeklyMomentumIncreasing and pullbackToEma20
// Initialize stop loss and take profit levels as float variables
var float longStopLevel = na
var float longTakeProfitLevel = na
// Calculate stop loss and take profit levels based on ATR
if (longCondition)
longStopLevel := close - (atrMultiplierSL * atrValue) // Stop loss at 1.5x ATR below the entry price
longTakeProfitLevel := close + (atrMultiplierTP * atrValue) // Take profit at 3x ATR above the entry price
// Strategy execution
if (longCondition)
strategy.entry("Long", strategy.long)
// Exit conditions: Stop-loss at 1.5x ATR and take-profit at 3x ATR
if (strategy.position_size > 0)
strategy.exit("Take Profit/Stop Loss", "Long", stop=longStopLevel, limit=longTakeProfitLevel)