
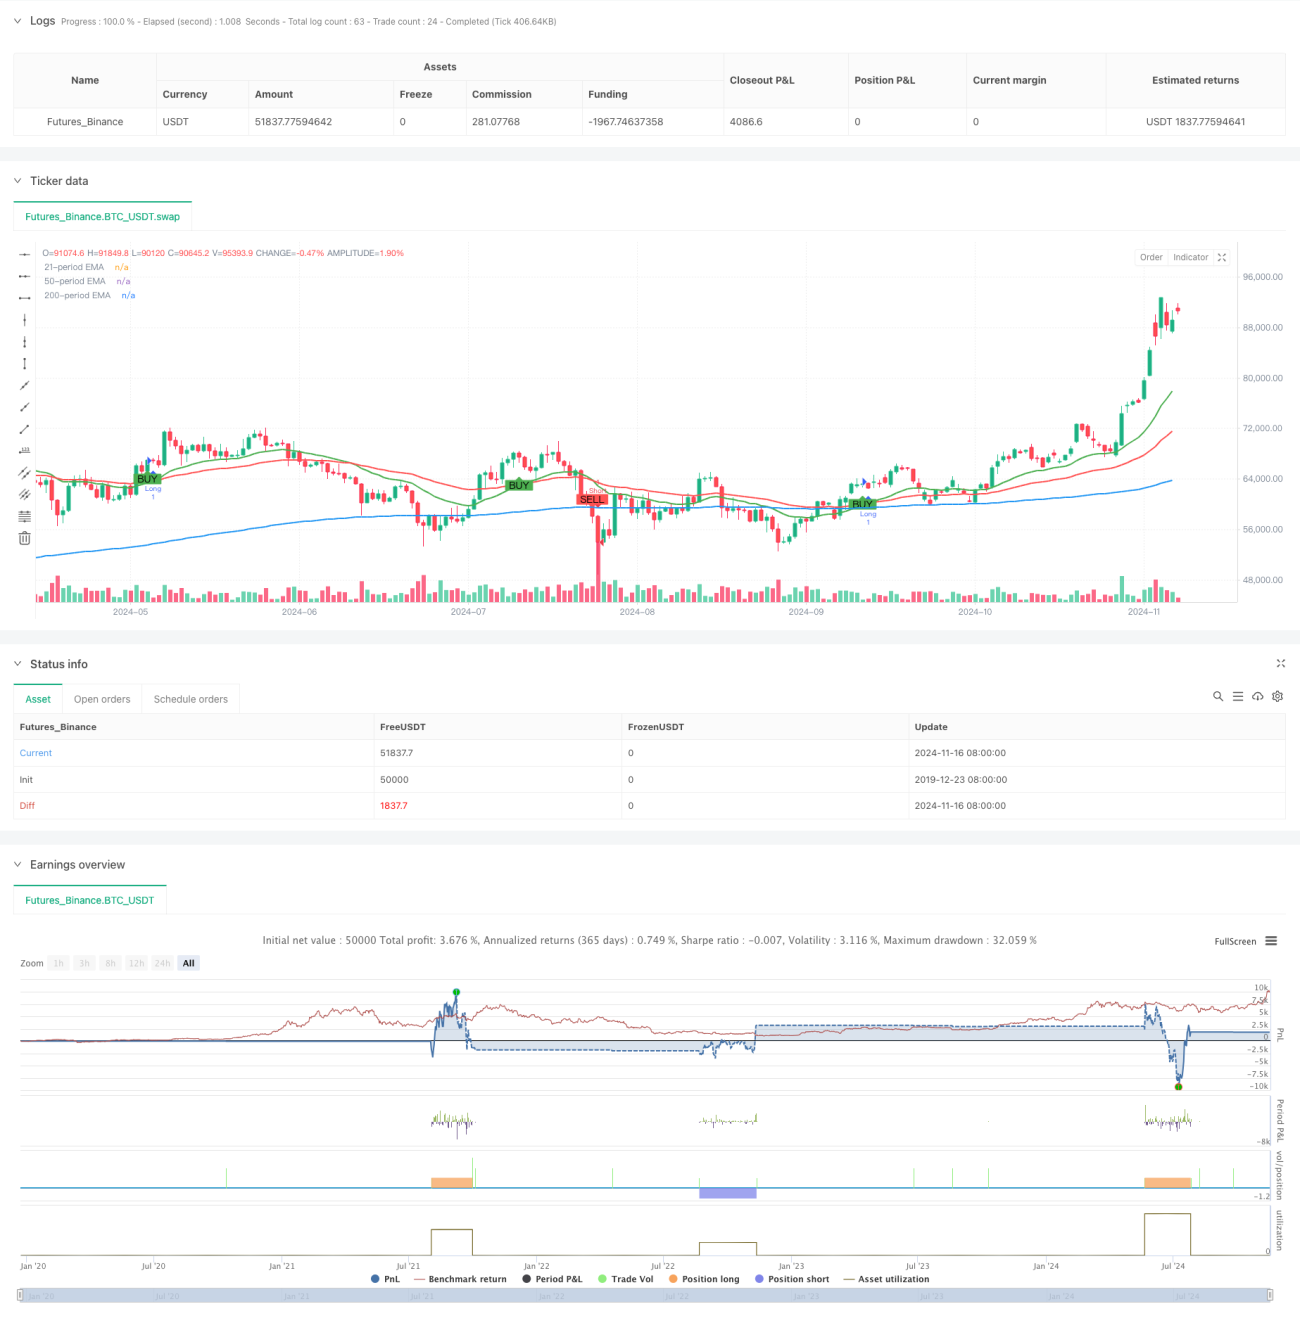
この戦略は,多指数移動平均 ((EMA) の交差に基づくトレンド追跡システムで,ダイナミックなストップ・ストップ・メカニズムを組み合わせている.この戦略は21周期,50周期,および200周期のトリプルEMAを採用し,短期と中期EMAの交差によって取引信号を生成し,長期EMAを利用して全体的なトレンドの方向を確認し,リスクを管理するために柔軟なストップ・ストップを設定します.この戦略は,波動性の高い市場環境,特に中期と長期のトレンド取引に適しています.
戦略の核心的な論理は,三重のEMAシステムの協同作用に基づいています.
この戦略は,複数のEMAシステムの協同作用により,市場動向を効果的に捉えることができる. 完善したリスク管理機構と明確な取引論理により,実用的な取引ツールとなる. 継続的な最適化と改善により,戦略は,異なる市場環境により良く適応し,取引効率と安定性を向上させることができる. 交易者は,実地での使用の前に十分な反射とパラメータの最適化を行い,市場特性と個人リスクの好みに合わせて適切な調整を行うことをお勧めします.
/*backtest
start: 2019-12-23 08:00:00
end: 2024-11-17 00:00:00
period: 1d
basePeriod: 1d
exchanges: [{"eid":"Futures_Binance","currency":"BTC_USDT"}]
*/
//@version=5
strategy("EMA Crossover with SL and TP Levels", overlay=true)
// Input settings for stop loss and take profit
slTicks = input.int(50, title="Stop Loss (ticks)", minval=1)
tpTicks = input.int(100, title="Take Profit (ticks)", minval=1)
// Input settings for moving averages
shortMAPeriod = input.int(21, title="Short MA Period")
longMAPeriod = input.int(50, title="Long MA Period")
thirdMAPeriod = input.int(200, title="Third MA Period")
// Calculate moving averages
shortMA = ta.ema(close, shortMAPeriod) // Short EMA (21-period)
longMA = ta.ema(close, longMAPeriod) // Long EMA (50-period)
thirdMA = ta.ema(close, thirdMAPeriod) // Third EMA (200-period)
// Detect crossovers for entry signals
bullishCross = ta.crossover(shortMA, longMA) and close > thirdMA
bearishCross = ta.crossunder(shortMA, longMA) and close < thirdMA
// Initialize variables for SL and TP
var float longSL = na
var float longTP = na
var float shortSL = na
var float shortTP = na
// Execute trades based on crossovers
if (bullishCross)
longSL := close - slTicks * syminfo.mintick
longTP := close + tpTicks * syminfo.mintick
strategy.entry("Long", strategy.long)
strategy.exit("Exit Long", "Long", stop=longSL, limit=longTP)
if (bearishCross)
shortSL := close + slTicks * syminfo.mintick
shortTP := close - tpTicks * syminfo.mintick
strategy.entry("Short", strategy.short)
strategy.exit("Exit Short", "Short", stop=shortSL, limit=shortTP)
// Plot the MAs
plot(shortMA, color=color.green, linewidth=2, title="21-period EMA")
plot(longMA, color=color.red, linewidth=2, title="50-period EMA")
plot(thirdMA, color=color.blue, linewidth=2, title="200-period EMA")
// Plot buy/sell signals
plotshape(series=bullishCross, title="Buy Signal", location=location.belowbar, color=color.green, style=shape.labelup, text="BUY", size=size.small, offset=-1)
plotshape(series=bearishCross, title="Sell Signal", location=location.abovebar, color=color.red, style=shape.labeldown, text="SELL", size=size.small, offset=-1)
// // Draw SL and TP lines for Long positions
// if (bullishCross)
// line.new(x1=bar_index, y1=longSL, x2=bar_index + 1, y2=longSL, color=color.red, width=2, style=line.style_dotted)
// line.new(x1=bar_index, y1=longTP, x2=bar_index + 1, y2=longTP, color=color.green, width=2, style=line.style_dotted)
// label.new(bar_index, longSL, text="Long SL", style=label.style_label_down, color=color.red, textcolor=color.white, size=size.small)
// label.new(bar_index, longTP, text="Long TP", style=label.style_label_up, color=color.green, textcolor=color.white, size=size.small)
// // Draw SL and TP lines for Short positions
// if (bearishCross)
// line.new(x1=bar_index, y1=shortSL, x2=bar_index + 1, y2=shortSL, color=color.red, width=2, style=line.style_dotted)
// line.new(x1=bar_index, y1=shortTP, x2=bar_index + 1, y2=shortTP, color=color.green, width=2, style=line.style_dotted)
// label.new(bar_index, shortSL, text="Short SL", style=label.style_label_down, color=color.red, textcolor=color.white, size=size.small)
// label.new(bar_index, shortTP, text="Short TP", style=label.style_label_up, color=color.green, textcolor=color.white, size=size.small)