大きなボラティリティのブレイクアウト双方向取引戦略:ポイントしきい値に基づくロングおよびショートエントリーシステム

1
Follow
1781
Followers
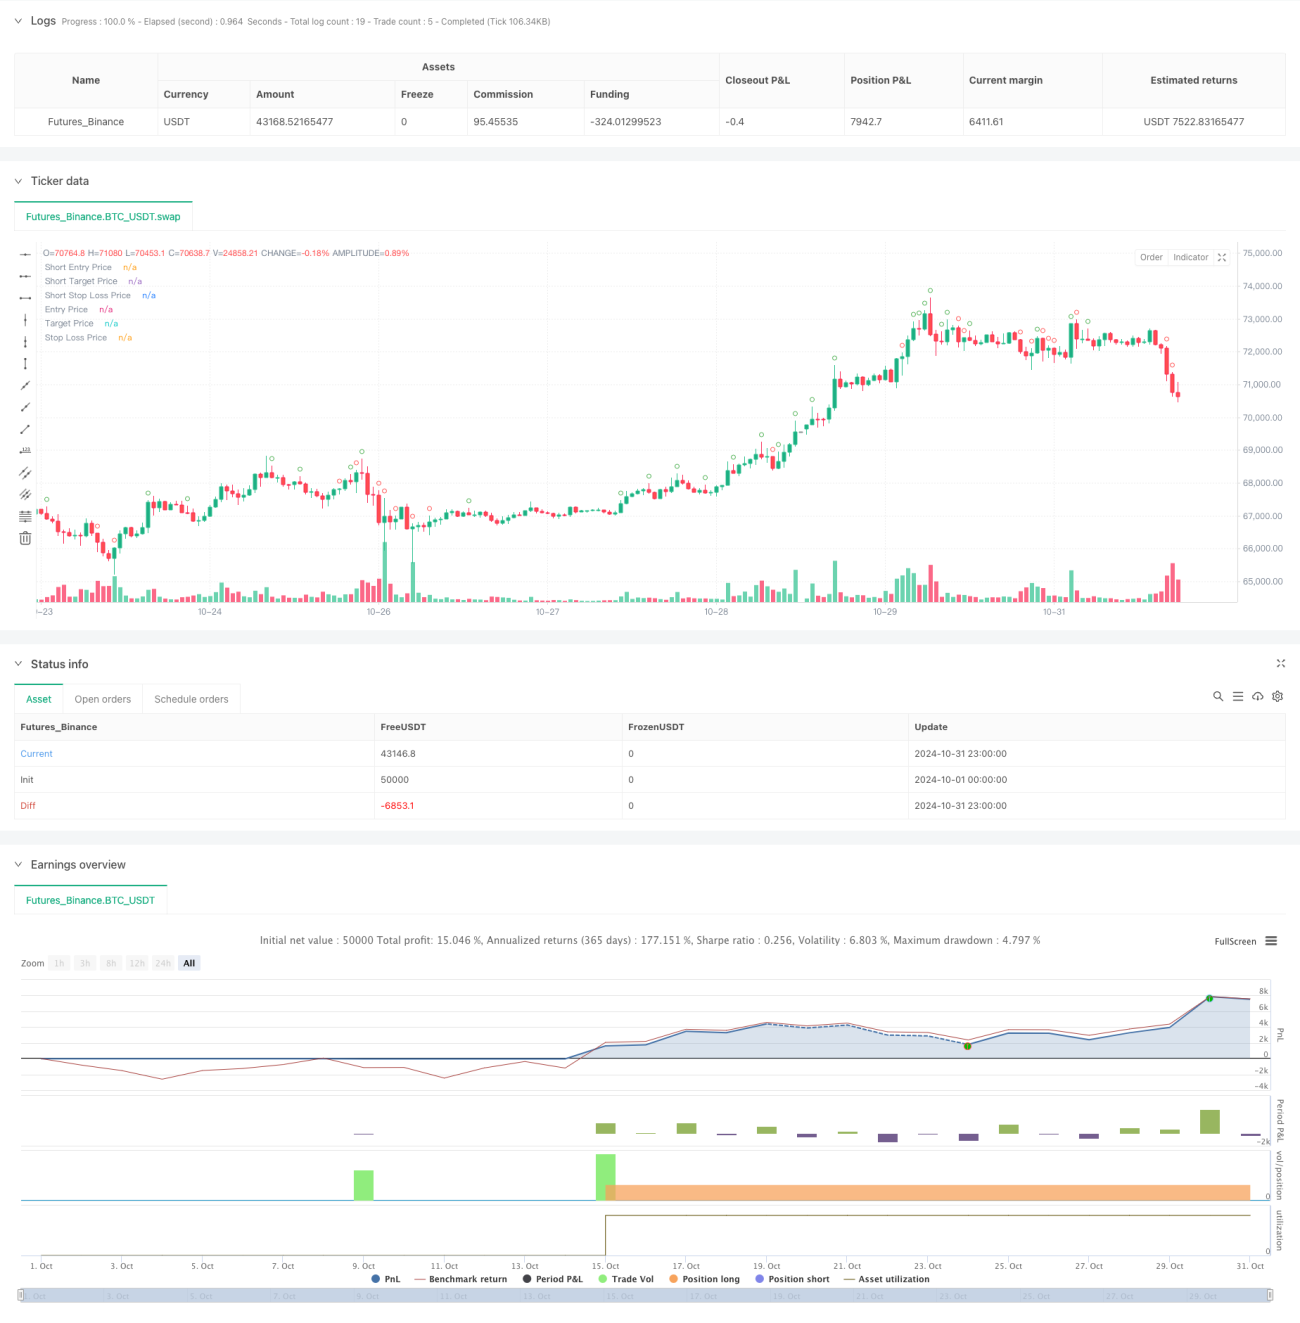
概要
この戦略は,価格の変動幅を監視して取引機会を探す30分間のK線に基づく二方向取引システムである.戦略の核心は,ポイントの<unk>値を設定して大幅な変動を認識し,突破確認後に相応の方向での取引である.戦略には,リスク管理可能な自動取引を実現するために,厳格な時間管理,ストップ・ロス,取引管理の仕組みが含まれている.
戦略原則
戦略は有効な取引信号を識別するために複数のフィルターメカニズムを使用する. まず,戦略は30分毎のK線の閉鎖時に実体波動の範囲を計算し,波動幅がデフォルトの<unk>値を超えると潜在的な取引機会としてマークされます. 戦略の有効性を確保するために,戦略は追加のバッファローズポイントを設定し,価格がこのバッファローズ領域を突破したときにのみ実際の取引信号を触発します.
戦略的優位性
- 優れた時間管理: 取引時間ウィンドウを制限し,非アクティブな時間の偽信号を避ける
- 双方向取引メカニズム:市場の双方向の機会を捉え,資金の利用効率を向上させる
- リスク管理の改善: リスク評価と管理を容易にするために,固定ポイントのストップストローを使用
- 高度な自動化: 信号認識から取引実行までの全過程を自動化し,人間の介入を減らす
- フレキシブルなパラメータ設定:異なる市場環境に対応するために,重要なパラメータを調整できます.
戦略リスク
- 偽突破リスク:大きな波動の後,偽突破が発生し,オフを停止する可能性があります.
- パラメータの感受性:不適切な<unk>値設定は,機会を逃したり,過度に取引したりする可能性があります.
- 市場環境依存性: 変動する市場では,頻繁にストップ・ロスを引き起こす可能性があります.
- スライドポイント影響:高波動期間の間,実際の取引価格は,シグナル価格から大きく偏っている可能性があります
- 資金管理のリスク:ポジション管理の欠如は,リスクの過剰な開口につながる可能性があります.
戦略最適化の方向性
- トレンドフィルターを追加: 長いサイクルのトレンド指標と組み合わせて,信号の質を向上させる
- ダイナミックパラメータ最適化:市場の変動に応じて,減値とストップ・ローズパラメータを自動的に調整する
- 交付量確認の導入:交付量フィルタリング条件を高め,突破信頼性を向上させる
- ストップ・ストップを最適化: ダイナミックなストップ・ストップを実現し,異なる市場環境に対応
- ポジション管理に追加:シグナル強さや市場の変動率に応じてポジションを動的に調整する
要約する
これは,設計が整え,論理が明瞭な自動取引戦略である.厳格な条件フィルタリングとリスク制御により,戦略は実用性が高い.しかし,まだ,実体で充分なテストと最適化が必要である.特に,パラメータ設定とリスク制御に関しては,実際の市場状況に合わせて調整する必要がある.戦略の成功運用には,安定した市場環境と適切なパラメータ配置が必要である.実体での使用の前に十分な裏返しテストが推奨されている.
Source
Pine
Strategy parameters
Related strategies
Comment
All comments (0)
No data
- 1