
1
Follow
1802
Followers
概要
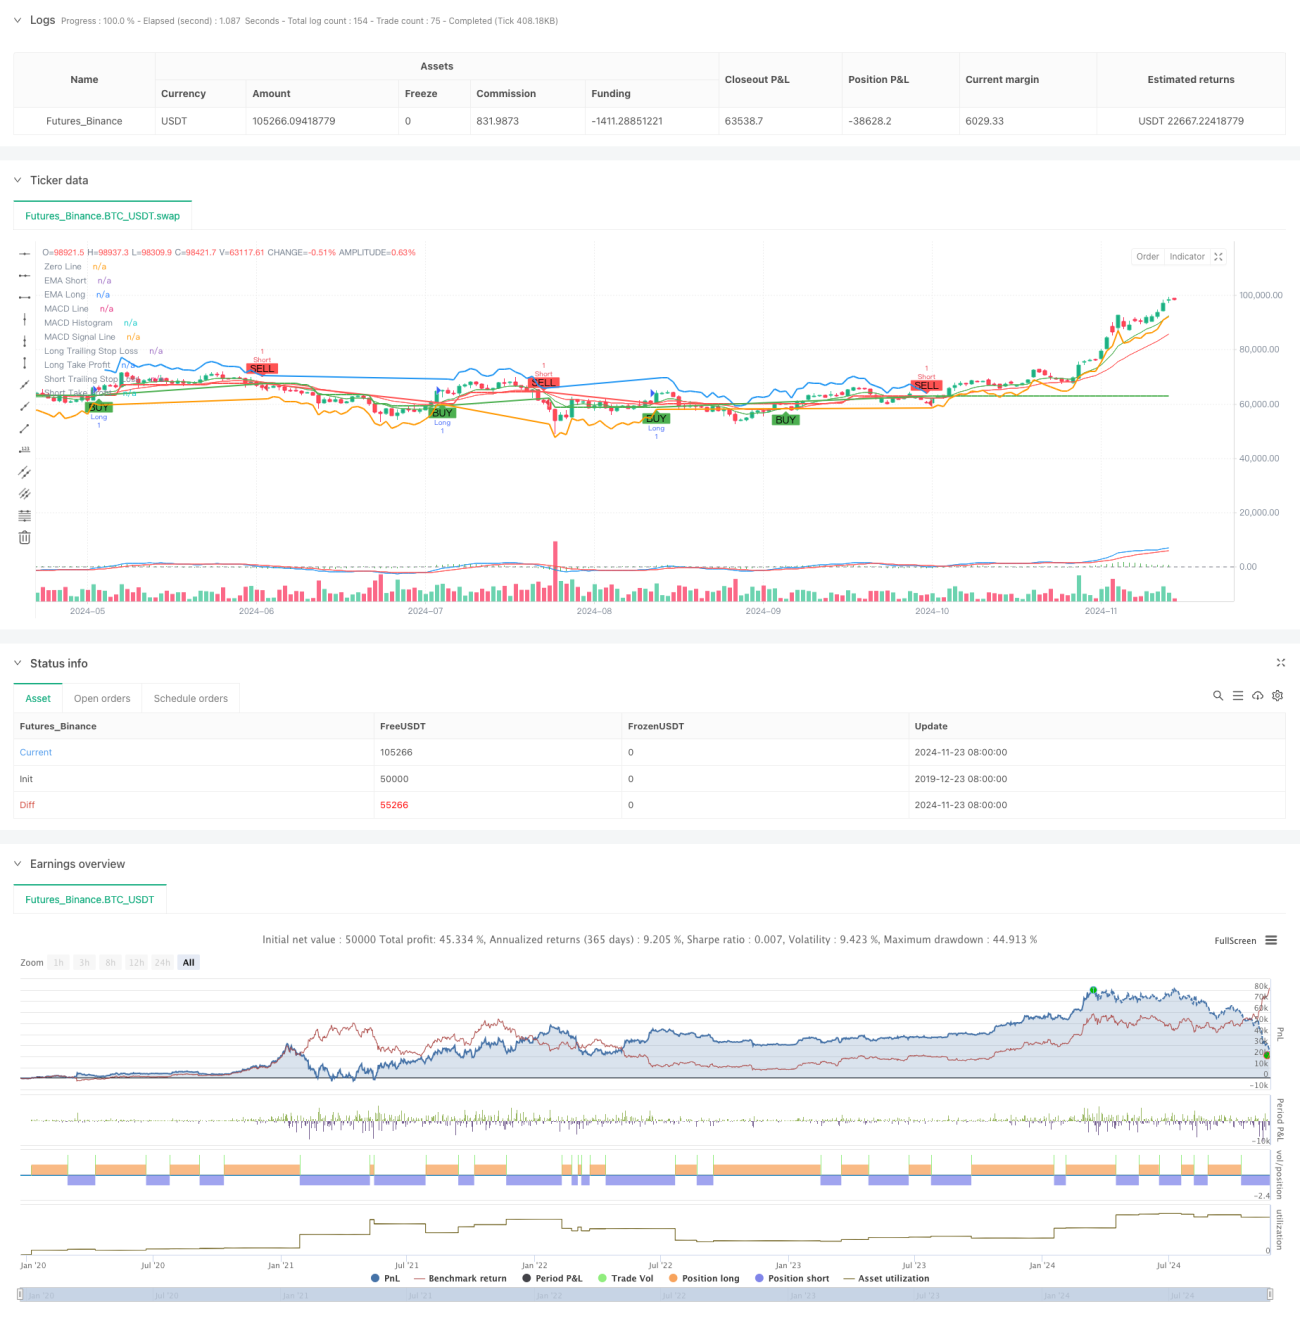
本戦略は包括的なトレンド追従型取引システムであり、複数時間枠分析、移動平均線システム、モメンタム指標、ボラティリティ指標を組み合わせています。システムは短期と長期の指数移動平均線(EMA)のクロスでトレンド方向を識別し、相対力指数(RSI)で買われ過ぎ・売られ過ぎを判断し、MACDでモメンタムを確認し、より高い時間枠のEMAをトレンドフィルターとして使用します。ATRに基づく動的ストップロスと利確方式を採用し、市場のボラティリティに適応します。
戦略の原理
戦略は多層検証メカニズムで取引判断を行います。
- トレンド識別層:9期間と21期間のEMAのクロスでトレンド変化を捉える
- モメンタム確認層:MACD指標(12,26,9)のクロスと方向でトレンドモメンタムを検証
- 買われ過ぎ・売られ過ぎフィルター:RSI(14)指標を70/30の水準でフィルタリング
- 高時間枠確認:オプションで日足レベルのEMAをトレンドフィルターとして使用
- リスク管理層:1.5倍ATRをトレーリングストップ、2倍ATRで利確目標を設定
システムは複数条件が揃った場合のみエントリーします。EMAクロス、RSIが極値に達していない、MACD方向が正しく、高時間枠トレンドが確認できていることです。エグジットはトレーリングストップと固定利確目標の組み合わせです。
戦略の優位性
- 多重検証メカニズムにより偽シグナルを大幅に低減
- 高時間枠トレンドフィルターで勝率向上
- ボラティリティベースの動的ストップで適応性が高い
- 完全なリスク管理体制
- パラメータは市場特性に応じて柔軟に調整可能
- 双方向取引に対応し、様々な市場環境に適応
- 指標の組み合わせがトレンドとモメンタムの両方を考慮
戦略のリスク
- 複数条件により一部の取引機会を逃す可能性
- レンジ相場では頻繁な取引が発生する可能性
- パラメータ最適化により過学習のリスク
- 高時間枠確認によりエントリーが遅れる可能性
解決策:
- 市場特性に応じてパラメータを動的に調整
- 取引方向選択の柔軟性を向上
- ボラティリティフィルターメカニズムの導入
- パラメータ適応メカニズムの最適化
戦略の最適化方向
- ボラティリティフィルターメカニズムの導入、高ボラティリティ期間のポジション調整
- パラメータ適応メカニズムの開発、市場状態に応じた動的調整
- 出来高指標の追加でシグナル有効性を確認
- 高時間枠トレンド判断ロジックの最適化
- ストップロス方式の改善、時間ストップの追加検討
- 戦略パフォーマンス評価モジュールの開発
まとめ
本戦略は完全なトレンド追従型取引システムであり、複数のテクニカル指標の組み合わせと厳格なリスク管理により、トレンド相場で安定した収益を得ることができます。システムの拡張性は高く、最適化により様々な市場環境に適応可能です。実取引に先立ち、十分なバックテストとパラメータ最適化を推奨します。
Source
Pine
Strategy parameters
Related strategies
Comment
All comments (0)
No data
- 1