
1
Follow
1781
Followers
概要
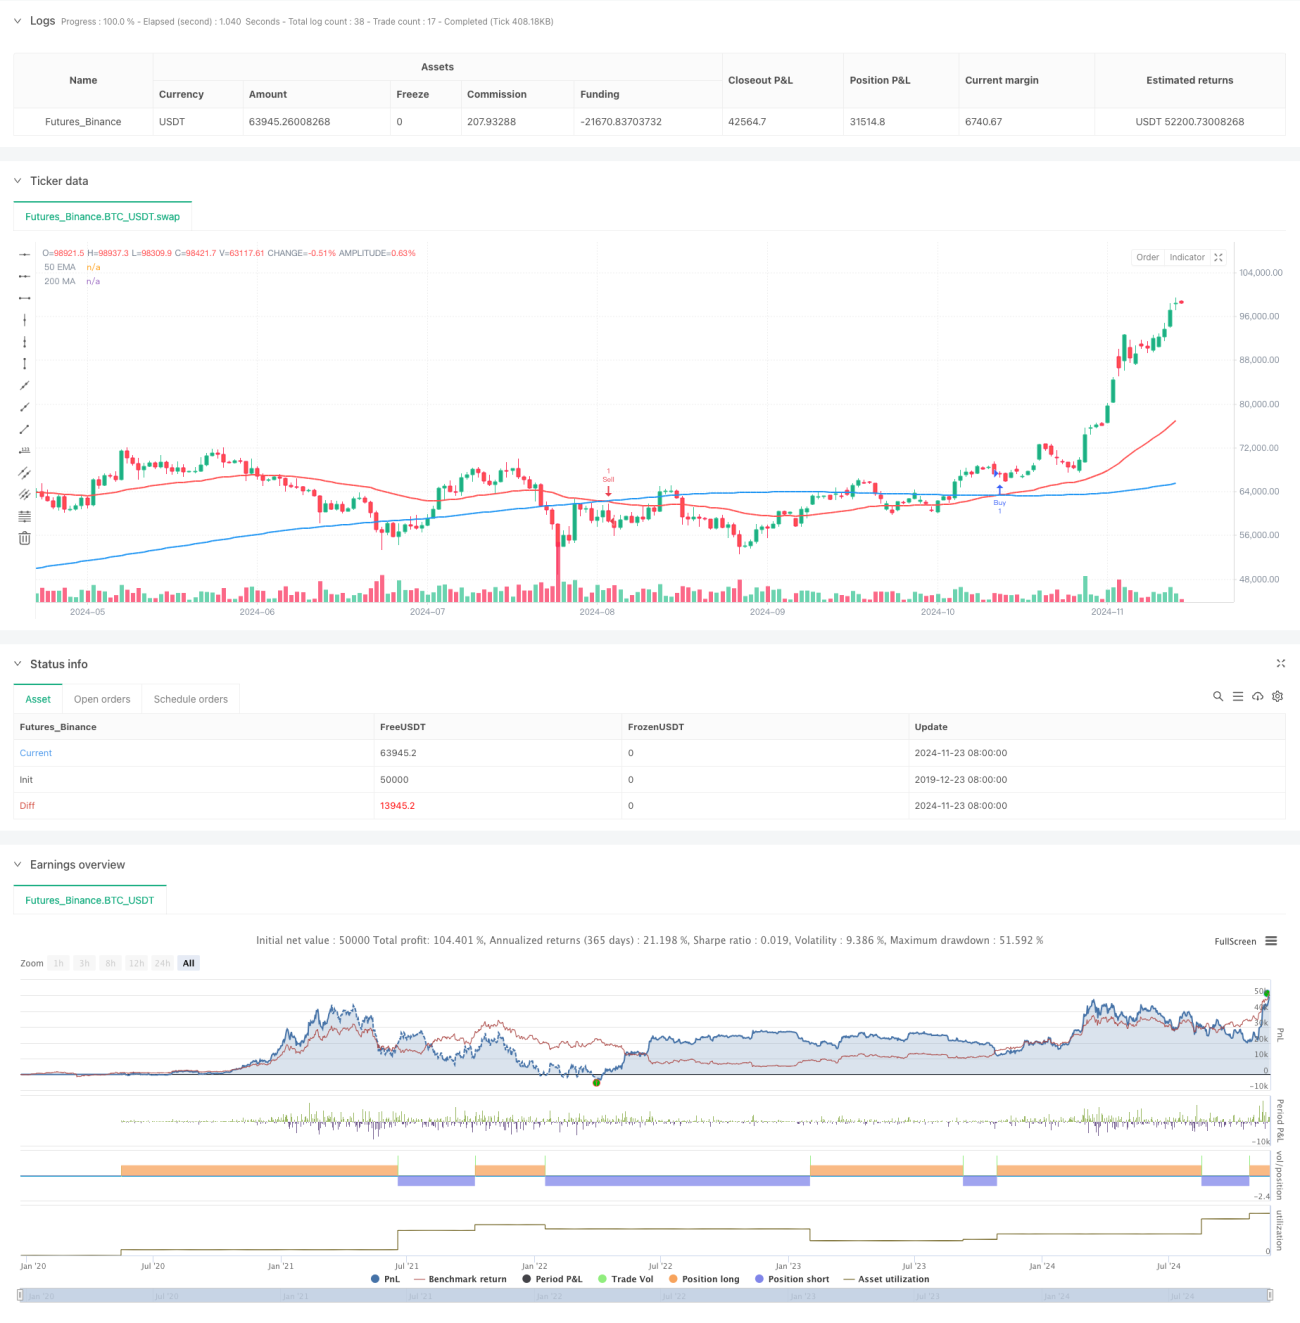
この戦略は,技術分析に基づいたトレンド追跡システムであり,主に50周期指数移動平均 ((EMA) と200周期簡易移動平均 ((MA) の交差信号を使用して市場のトレンドを捕捉する.戦略は,ダイナミックなストップ・ストップ・損失機構を統合し,予め設定されたストップ・損失とストップ・ポイントを介してリスクを制御し,収益をロックします.この組み合わせは,戦略が大きなトレンドを把握し,状況が逆転するときに間に合わせた損失を止めるようにします.
戦略原則
戦略の核心的な論理は,2つの均線の交差判断に基づいています:50周期EMAが上向きに200周期MAを渡るとき,システムは多信号を生成し;50周期EMAが下向きに200周期MAを渡るとき,システムは空白信号を生成します. ポジションを開けた後,システムは自動的にストロップ・ローズ・エントリー ((入場価格より3ポイント下) とストップ・ストップ・ポジション ((入場価格より7.5ポイント下)) を設定します. さらに,逆転信号が生じたとき,システムは自動的に現在のポジションを平準化して,ポジションの方向が市場動向と矛盾しないようにします.
戦略的優位性
- トレンド・トラッキング性: 急速な平均線と遅い平均線を組み合わせて,市場トレンドの転換タイミングを効果的に捉える
- リスク管理の改善: ダイナミックなストップ・ストップ・メカニズムを統合し,取引ごとにリスクを効果的に管理します.
- 体系化度が高い:取引信号が明確で,ストップ・ストップ・ロスは固定され,主観的な判断への干渉が軽減される
- 適応性:戦略は,異なる市場環境と取引の種類に適用できます
- 操作の簡素性:入場と出場の論理が明確で,実行と反省が容易である
戦略リスク
- 振動市場リスク:横盤振動市場では,偽の突破が頻繁に起こり,連続したストップダウスを引き起こす可能性があります.
- スリップポイントリスク:市場が激しく波動する時には,実際の取引価格が理論価格から大きく偏っている可能性があります.
- 固定ストップリスク: 設定された固定ストップポイントは,すべての市場環境には適さない可能性があります.
- トレンド反転リスク:突然のトレンド反転で,一時的な停止が遅れる可能性
- 資金管理のリスク: 固定ストップは異なる規模の口座には適さない
戦略最適化の方向性
- 波動率指標の導入:市場の波動率の動向に応じてストップ・ロスの幅を調整する
- RSIやMACDのようなトレンド確認指標を増加させ,取引信号の信頼性を向上させる
- 資金管理の最適化:口座規模と市場の変動動向に応じてポジションの規模を調整する
- 市場環境フィルターを追加:横軸の変動市場での取引頻度を下げるか,取引を一時停止する
- 改善された出場メカニズム:移動の止損を増加させ,収益を最大化する
要約する
この戦略は,古典的な双均線交差システムと動的止損止損機構を組み合わせて,完全なトレンド追跡取引システムを構築する.戦略の優点は,体系化度が高いこと,リスク管理が完善であることにあるが,実際の適用では,特定の市場環境と資金の規模に応じて最適化調整が必要である.より多くの技術指標を追加し,資金管理方法を改善することにより,戦略の安定性と収益性を向上させる余地もある.安定した収益を追求する投資家のための参考に値する基本的な戦略の枠組みである.
Source
Pine
Related strategies
Comment
All comments (0)
No data
- 1