MACD-EMA マルチ期間ダイナミッククロスオーバー定量取引システム

1
Follow
1780
Followers
概要
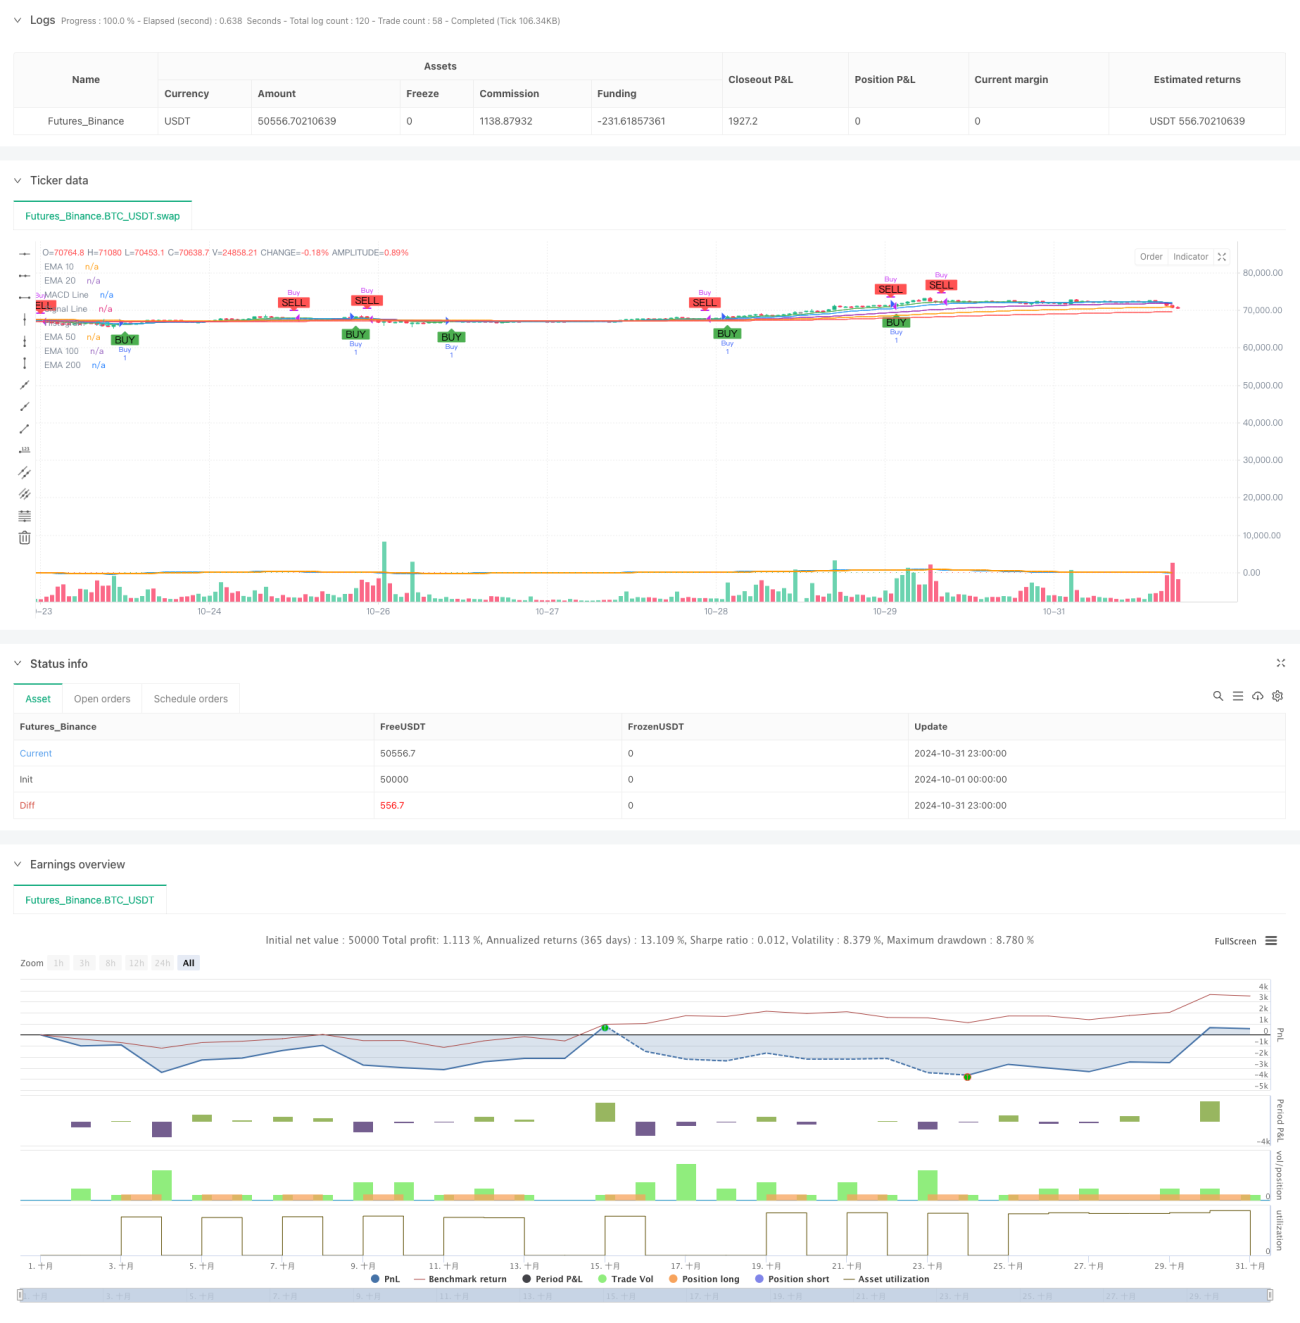
この戦略は,MACDと多周期EMA指標をベースにした量化取引システムである.この戦略は,MACD指標のトレンド追跡特性と,複数のEMA均線のサポートレジスタンス特性を組み合わせて,完全な取引意思決定システムを構築している.このシステムは,買入シグナルの生成だけでなく,リアルタイムで警告機能を統合し,トレーダーが市場機会を把握するのに役立ちます.
戦略原則
戦略の核心的な論理は,2つの主要な技術指標の上に構築されています. まず,MACD指標は,それは,快線 (※12サイクル) と慢線 (※26サイクル) を構成し,両線の交差によって取引信号を生成します. MACD線上の信号線を横断すると買入シグナルが生成され,下を横断すると売出シグナルが生成されます. 次に,戦略は,5つの異なる周期の指数移動平均を導入します.
戦略的優位性
- 信号システムの改善: MACD指標のトレンド追跡機能と複数のEMAのトレンド確認機能を組み合わせた.
- 多次元分析:異なる周期のEMAを通じて取引決定のための多層の市場構造の参考を提供する.
- リアルタイムアラート: 取引機会を早期に発見するために,買入・売却の信号のリアルタイムアラート機能が組み込まれています.
- 視覚効果: 戦略はグラフに明確な買入シグナルを表示し,トレーダーが市場動向を直感的に理解できるようにする.
- パラメータの調整: 異なる市場環境に応じて最適化するために,コアパラメータはカスタマイズできます.
戦略リスク
- 遅滞のリスク:MACDとEMAは遅滞の指標であり,激しい波動の市場で信号遅滞が発生する可能性があります.
- 偽突破リスク:横盤整理段階では,頻繁に偽突破信号が発生する可能性があります.
- トレンドの逆転リスク:大きなトレンドの転換点では,戦略の適応性が不足する可能性があります.
- パラメータの感受性:異なる市場環境において,固定されたパラメータは,戦略の効果を不安定にすることがあります.
戦略最適化の方向性
- 波動率フィルターの導入:ATRまたはブリン帯などの波動率指標の追加が推奨され,低波動率環境下での偽信号のフィルタリングに使用されます.
- 交差量確認:交差量指標を組み合わせて信号の信頼性を高めることができる.
- ストップ・メカニズムを最適化:トラッキングストップやATRベースのストップ・セットなどのダイナミックストップ機能を追加することが推奨されている.
- 市場環境の分類を増やす:異なる市場環境 ((トレンド/揺れ)) に応じて戦略パラメータを動的に調整することができる.
- リスク管理モジュールを追加: ポジション管理とリスク管理機能を追加することを推奨する.
要約する
この戦略は,MACDと多周期EMA指標を組み合わせて,より完全な取引システムを構築している.システムの優点は,信号が明確で,分析が次元に富み,優れたビジュアル効果があることである.しかし,同時に,遅滞や偽信号などの固有のリスクもある.波動率フィルタリング,取引量確認などの最適化措置を追加することによって,戦略の安定性と信頼性をさらに向上させることができる.この戦略は,中長期のトレーダーが使用するのに適しており,特に傾向が明確な市場環境下では,より優れたパフォーマンスを発揮する.
Source
Pine
Strategy parameters
Related strategies
Comment
All comments (0)
No data
- 1