
1
Follow
1802
Followers
概要
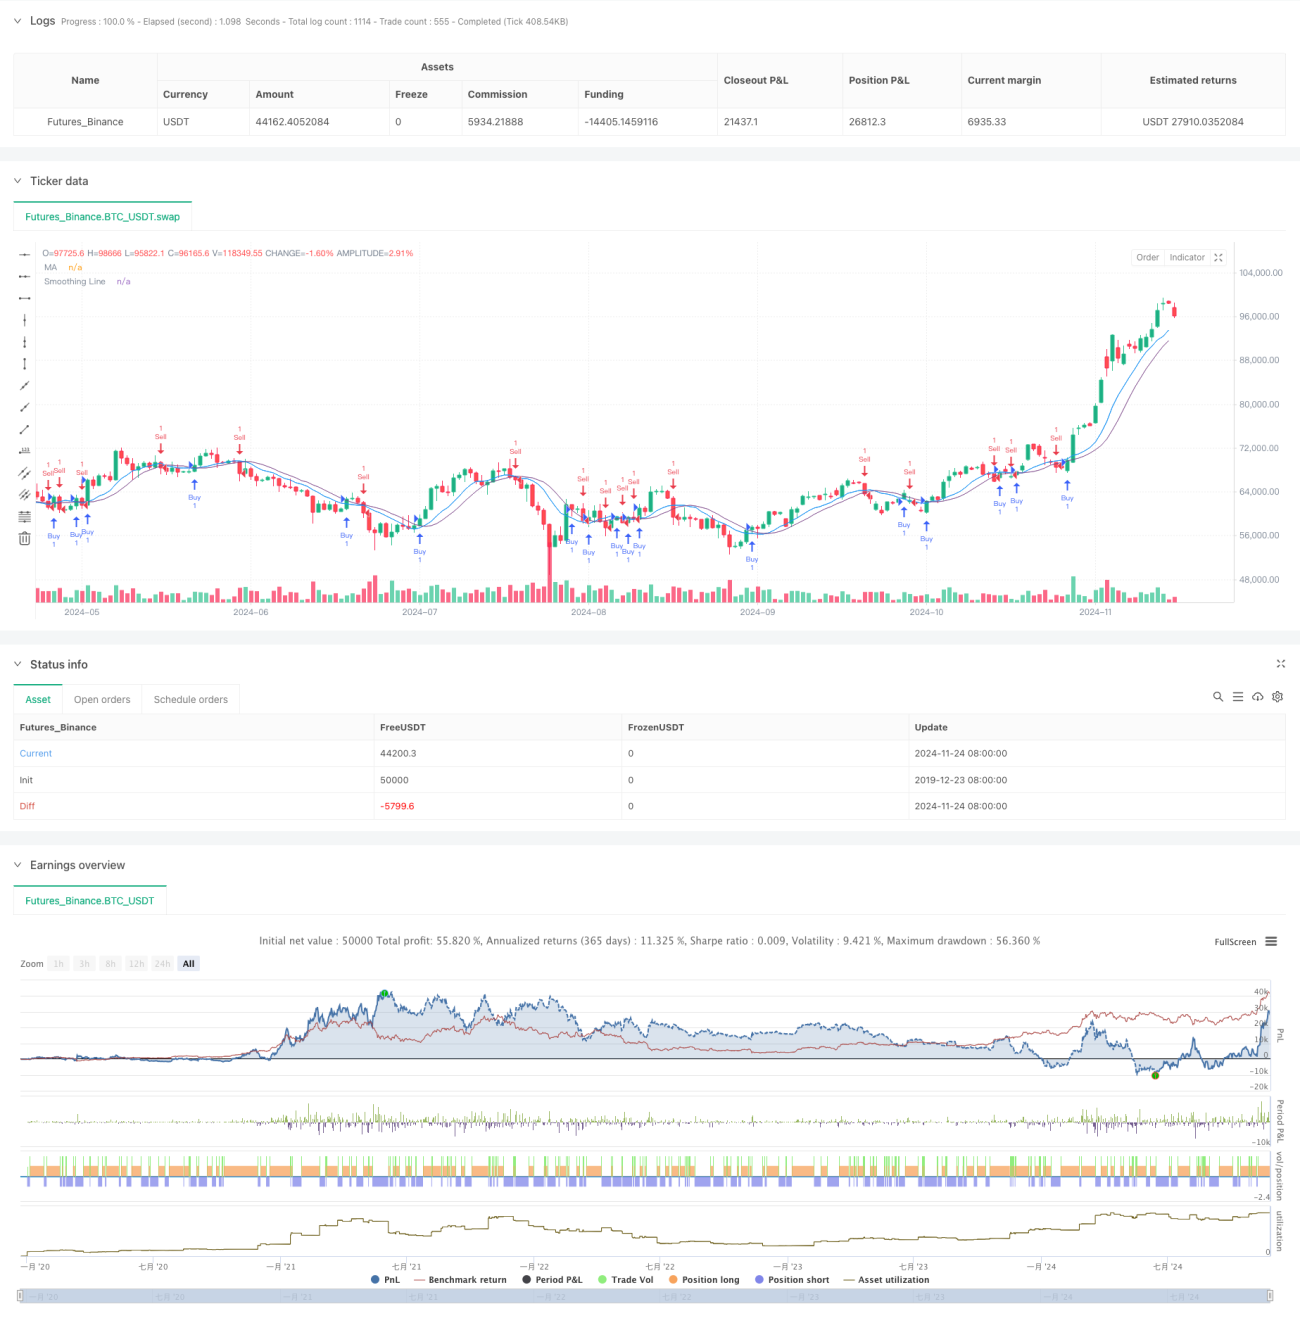
これは二重移動平均線のクロスシグナルに基づく定量取引戦略です。本戦略は2本の移動平均線を採用しており、1本は主シグナル線、もう1本は平滑化シグナル線として機能します。価格と平滑化シグナル線のクロス状況を監視することで取引シグナルを生成し、市場のトレンド把握とモメンタム追跡を実現します。戦略の核となる利点は、シンプルかつ効果的なシグナル生成メカニズムと、柔軟なパラメータ設定オプションにあります。
戦略原理
本戦略では2段階の移動平均線計算を使用します。まず基本となる移動平均線(デフォルト期間9)を計算し、次にこの平均線を2次平滑化(デフォルト期間5)します。戦略では複数の移動平均線計算方法から選択可能であり、単純移動平均線(SMA)、指数移動平均線(EMA)、平滑移動平均線(SMMA)、加重移動平均線(WMA)、出来高加重移動平均線(VWMA)が含まれます。終値が平滑化シグナル線を上抜けた場合に買いシグナル、下抜けた場合に売りシグナルを生成します。
戦略の利点
- シグナル生成メカニズムが明確かつシンプルで、理解と実装が容易
- 2次平滑化処理により、偽シグナルの発生を効果的に低減
- 複数の移動平均線計算方法を提供し、市場特性に応じて柔軟に選択可能
- パラメータ設定が柔軟で、異なる市場サイクルに合わせて最適化可能
- コード構造が明確で、保守と拡張が容易
- 優れたトレンド追跡能力を持つ
戦略のリスク
- レンジ相場では頻繁な取引シグナルが発生し、取引コストが増加する可能性
- 一定のラグが存在し、相場の始点を見逃す可能性
- 急激な反転相場では大きなドローダウンが発生する可能性
- 単一のテクニカル指標戦略であり、市場環境の判断が不足
- 過度なパラメータ最適化はオーバーフィッティングのリスクを招く
戦略の改善方向
- 市場環境判断メカニズムを導入し、異なる市場状態で異なるパラメータ設定を使用
- ストップロス・テイクプロフィットメカニズムを追加し、リスクを管理
- 取引量フィルターを追加し、低流動性環境での取引を回避
- 他のテクニカル指標を補助確認シグナルとして導入
- 適応的パラメータメカニズムを開発し、市場の変化に応じて動的にパラメータを調整
- ポジション管理モジュールを追加し、より柔軟なポジションコントロールを実現
まとめ
本戦略は古典的なトレンド追跡戦略の改良版であり、二重移動平均線の設計により、戦略のシンプルさを維持しつつ安定性を高めています。拡張性と柔軟性に優れており、パラメータ最適化や機能拡張を通じて様々な市場環境に適応できます。ただし、取引コストの管理とリスク管理に注意が必要であり、実取引前に十分なバックテストによる検証を推奨します。
Source
Pine
Strategy parameters
Related strategies
Comment
All comments (0)
No data
- 1