
1
Follow
1781
Followers
概要
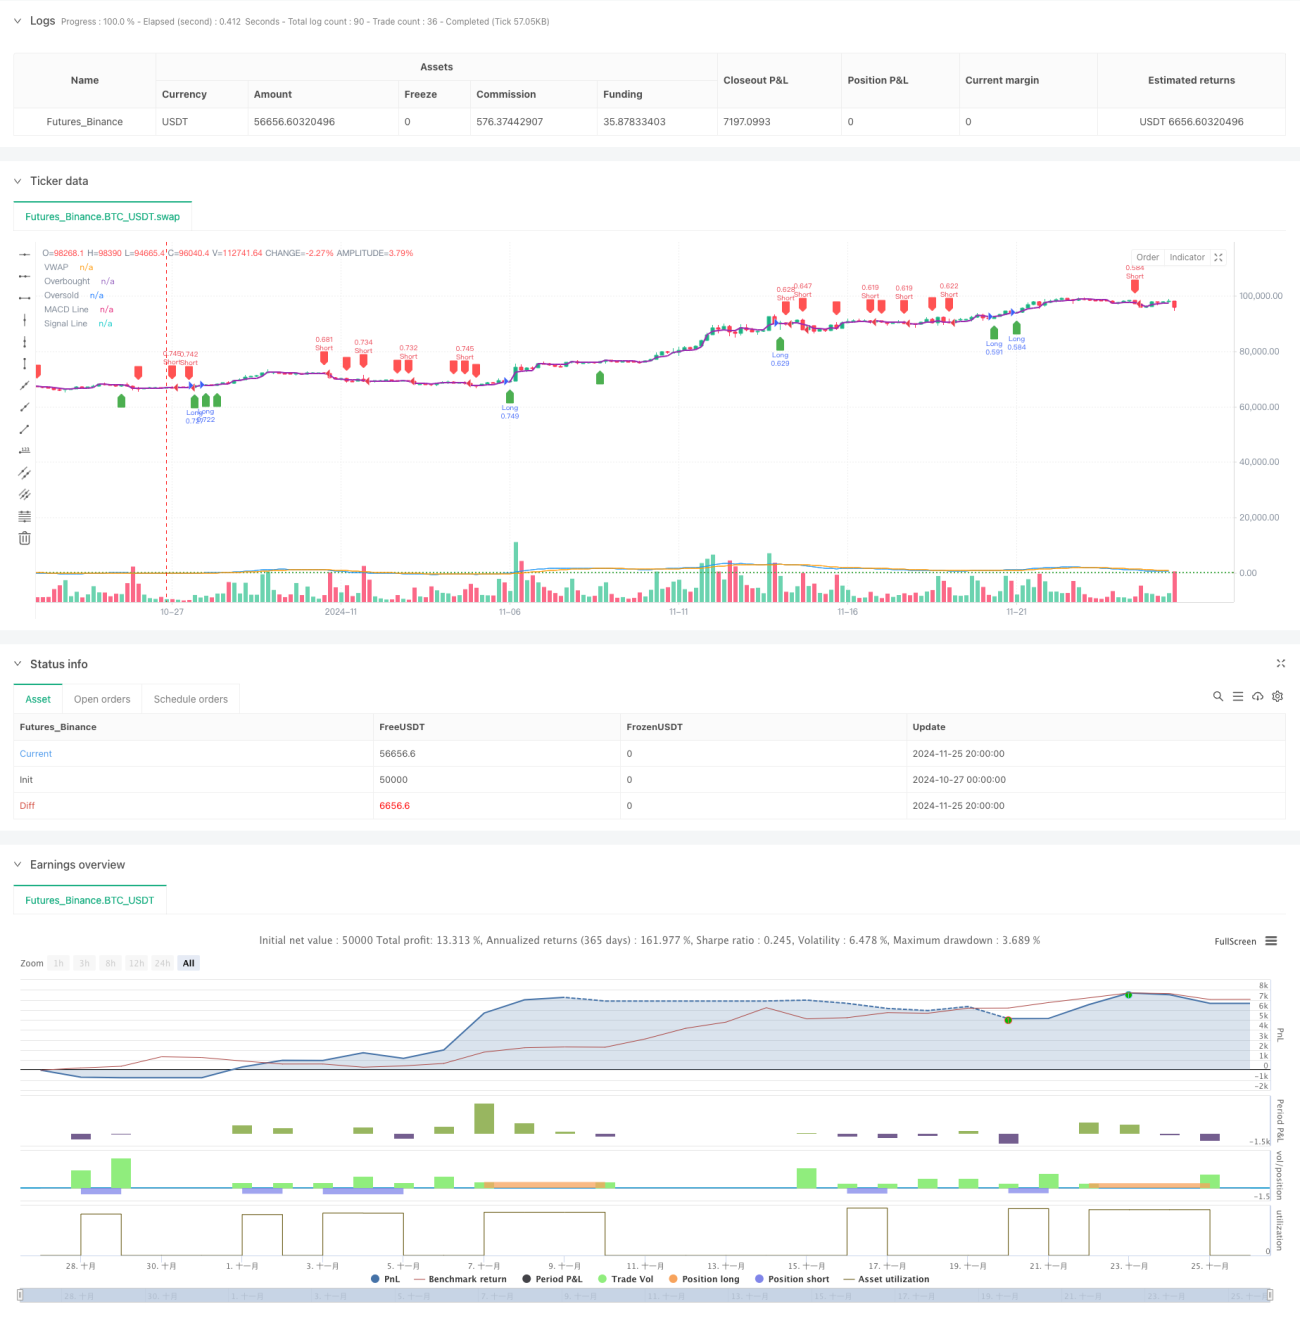
これは,VWAP,MACD,RSIの三重技術指標に基づいた量化取引戦略である.この戦略は,交差重量平均価格 (VWAP),移動平均の近似分散指標 (MACD) および相対的に強い指標 (RSI) の複数のシグナルを組み合わせて,市場の買入の機会を識別する.この戦略は,パーセントのストップ・ローズメカニズムを使用してリスクを管理し,戦略的なポジション管理を使用して,資金利用を最適化します.
戦略原則
戦略の核心的な論理は,以下の3つの主要な指標の統合分析に基づいています.
- VWAPを主要なトレンド参照線として使用し,価格がVWAPを突破すると潜在的トレンド転換信号と見なす
- MACD柱状グラフは,トレンドの強さと方向を確認するために使用され,正値は上昇傾向を示し,負値は下降傾向を示します.
- RSIは,市場が過買または過売状態にあるかどうかを識別するために使用され,極端な状況で入場を避ける
購入条件は以下の通りです.
- VWAPの価格が上昇した
- MACDの柱状は正の値である
- RSIは超買値に達していない
販売条件は以下の通りです.
- VWAPの価格が下がった
- MACDの柱状のグラフはマイナスです.
- RSIは超売りレベルに達していない
戦略的優位性
- 複数の技術指標のクロス検証により,信号の信頼性が向上
- VWAPで取引量要素を導入し,市場深度分析を追加する
- RSIは極端な動きをフィルターし,偽突破のリスクを低減する
- パーセンテージ・ストップ・ロスを採用し,異なる価格区間に動的に適応する
- ポジションサイジング アカウントの純資産比率に基づいて,ダイナミックなポジション管理を実現
- 戦略の論理は明確で,理解し,維持しやすい
戦略リスク
- 市場が揺れ動くと取引が頻繁になり,取引コストが上がる可能性があります.
- 複数の指標が信号の遅延を引き起こし,入場時刻に影響を与える可能性がある
- 固定パーセンテージストップロスは,すべての市場環境に適さない可能性があります.
- 市場変動の変動を考慮せずに,高波動期にリスクが増加する可能性があります.
- トレンドの強度フィルターの欠如,弱トレンドの市場で過剰なシグナルを生成する可能性がある
戦略最適化の方向性
- ATRの動的調整ストップ・ローズ幅を導入し,市場の波動に適した状態に
- トレンド強度フィルターを追加し,波動市場の偽信号を減らす
- VWAP周期設定を最適化し,複数周期VWAP組み合わせを考慮する
- 交差量確認メカニズムを導入し,突破信号の信頼性を向上させる
- 低流動性期間の取引を避けるため,時間フィルターを追加することを検討する
- 動的に調整されるポジションサイジング機構,市場条件に応じてポジションサイズを調整する
要約する
この戦略は,VWAP,MACD,RSIの3つのクラシックな技術指標を統合して,比較的完全な取引システムを構築している.戦略は,設計上,信号の信頼性とリスク管理を重視し,複数の指標のクロス検証によって取引品質を向上させる.いくつかの最適化が必要な側面があるが,全体的な枠組みは合理的で,良好な拡張性がある.トレーダーは,現場で使用する前に,検証戦略のパフォーマンスを異なる市場環境下で裏返し,特定の需要に応じてパラメータを最適化することをお勧めする.
Source
Pine
/*backtest
start: 2024-10-27 00:00:00
end: 2024-11-26 00:00:00
period: 4h
basePeriod: 4h
exchanges: [{"eid":"Futures_Binance","currency":"BTC_USDT"}]
*/

//@version=5
strategy("pbs", overlay=true, default_qty_type=strategy.percent_of_equity, default_qty_value=100)

// Input for take-profit and stop-lossStrategy parameters
Related strategies
Comment
All comments (0)
No data
- 1