
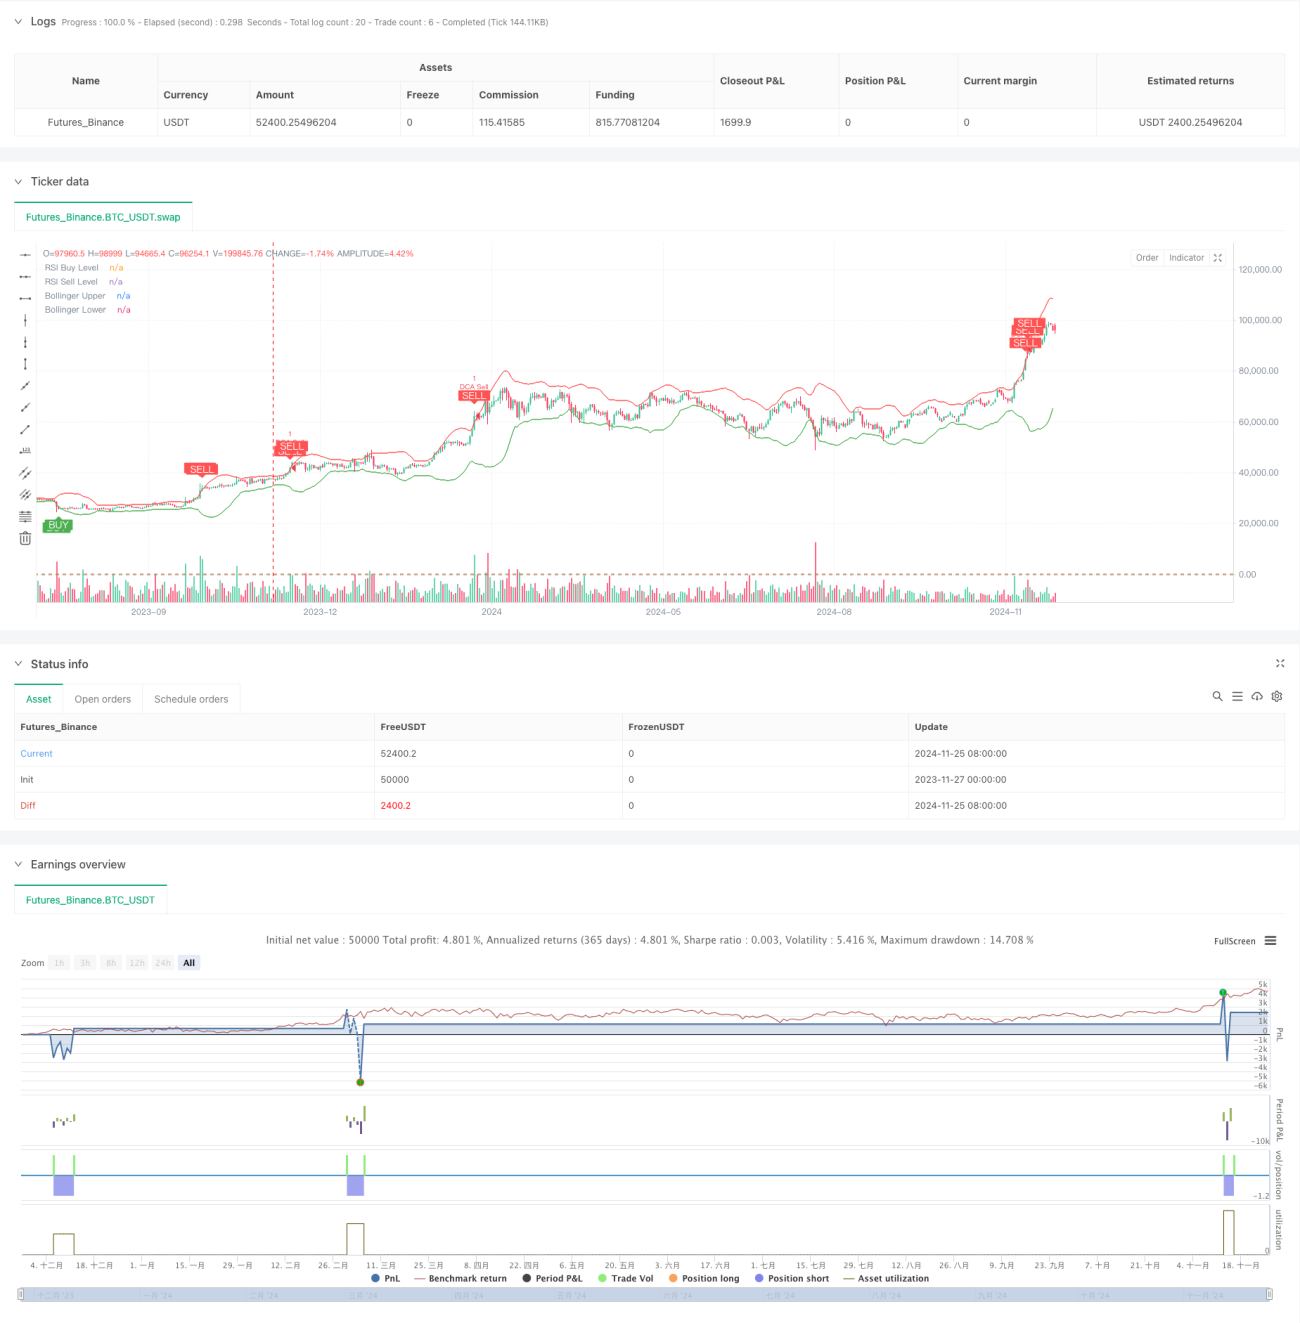
この戦略は,ブリン帯 ((Bollinger Bands),相対的に強い指標 ((RSI) と動的コスト平均 ((DCA) を組み合わせた量的な取引システムである.戦略は,資金管理のルールを設定し,市場の波動で自動的にバッチアップポーズ操作を実行し,同時に,技術指標と組み合わせて,買入シグナル判断を行い,リスクを制御できる取引実行を実現する.システムには,ストップストップロジックと累積利益の追跡機能が含まれ,取引のパフォーマンスを効果的に監視および管理することができます.
この戦略は主に以下のコアコンポーネントに基づいています。
この戦略は,総合的な技術分析と資金管理方法の適用によって,比較的完全な取引システムを構築している.この戦略の優点は,複数の信号の確認と優れたリスク管理にあるが,まだ実盤で十分なテストと最適化が必要である.パラメータ設定の継続的な改善と補助指標の追加により,この戦略は,実際の取引で安定したパフォーマンスを期待されている.
/*backtest
start: 2023-11-27 00:00:00
end: 2024-11-26 00:00:00
period: 1d
basePeriod: 1d
exchanges: [{"eid":"Futures_Binance","currency":"BTC_USDT"}]
*/
//@version=5
strategy("Combined BB RSI with Cumulative Profit, Market Change, and Futures Strategy (DCA)", shorttitle="BB RSI Combined DCA Strategy", overlay=true)
// Input Parameters
length = input.int(20, title="BB Length") // Adjusted BB length
mult = input.float(2.5, title="BB Multiplier") // Adjusted BB multiplier
rsiLength = input.int(14, title="RSI Length") // Adjusted RSI length
rsiBuyLevel = input.int(25, title="RSI Buy Level") // Adjusted RSI Buy Level
rsiSellLevel = input.int(75, title="RSI Sell Level") // Adjusted RSI Sell Level
dcaPositionSizePercent = input.float(1, title="DCA Position Size (%)", tooltip="Percentage of equity to use in each DCA step")
takeProfitPercentage = input.float(5, title="Take Profit (%)", tooltip="Take profit percentage for DCA strategy")
// Calculate DCA position size
equity = strategy.equity // Account equity
dcaPositionSize = (equity * dcaPositionSizePercent) / 100 // DCA position size as percentage of equity
// Bollinger Bands Calculation
basis = ta.sma(close, length)
dev = mult * ta.stdev(close, length)
upper = basis + dev
lower = basis - dev
// RSI Calculation
rsi = ta.rsi(close, rsiLength)
// Plotting Bollinger Bands and RSI levels
plot(upper, color=color.red, title="Bollinger Upper")
plot(lower, color=color.green, title="Bollinger Lower")
hline(rsiBuyLevel, "RSI Buy Level", color=color.green)
hline(rsiSellLevel, "RSI Sell Level", color=color.red)
// Buy and Sell Signals
buySignal = (rsi < rsiBuyLevel and close <= lower)
sellSignal = (rsi > rsiSellLevel and close >= upper)
// DCA Strategy: Enter Long or Short based on signals with calculated position size
if (buySignal)
strategy.entry("DCA Buy", strategy.long)
if (sellSignal)
strategy.entry("DCA Sell", strategy.short)
// Take Profit Logic
if (strategy.position_size > 0) // If long
strategy.exit("Take Profit Long", from_entry="DCA Buy", limit=close * (1 + takeProfitPercentage / 100))
if (strategy.position_size < 0) // If short
strategy.exit("Take Profit Short", from_entry="DCA Sell", limit=close * (1 - takeProfitPercentage / 100))
// Plot Buy/Sell Signals on the chart
plotshape(buySignal, title="Buy Signal", location=location.belowbar, color=color.green, style=shape.labelup, text="BUY", textcolor=color.white)
plotshape(sellSignal, title="Sell Signal", location=location.abovebar, color=color.red, style=shape.labeldown, text="SELL", textcolor=color.white)
// Alerts for Buy/Sell Signals
alertcondition(buySignal, title="Buy Alert", message="Buy Signal Detected")
alertcondition(sellSignal, title="Sell Alert", message="Sell Signal Detected")
// Cumulative Profit Calculation
var float buyPrice = na
var float profit = na
var float cumulativeProfit = 0.0 // Cumulative profit tracker
if (buySignal)
buyPrice := close
if (sellSignal and not na(buyPrice))
profit := (close - buyPrice) / buyPrice * 100
cumulativeProfit := cumulativeProfit + profit // Update cumulative profit
label.new(bar_index, high, text="P: " + str.tostring(profit, "#.##") + "%", color=color.blue, style=label.style_label_down)
buyPrice := na // Reset buyPrice after sell
// Plot cumulative profit on the chart
var label cumulativeLabel = na
if (not na(cumulativeProfit))
if not na(cumulativeLabel)
label.delete(cumulativeLabel)
cumulativeLabel := label.new(bar_index, high + 10, text="Cumulative Profit: " + str.tostring(cumulativeProfit, "#.##") + "%", color=color.purple, style=label.style_label_up)
// Market Change over 3 months Calculation
threeMonthsBars = 3 * 30 * 24 // Approximation of 3 months in bars (assuming 1 hour per bar)
priceThreeMonthsAgo = request.security(syminfo.tickerid, "D", close[threeMonthsBars])
marketChange = (close - priceThreeMonthsAgo) / priceThreeMonthsAgo * 100
// Plot market change over 3 months
var label marketChangeLabel = na
if (not na(marketChange))
if not na(marketChangeLabel)
label.delete(marketChangeLabel)
marketChangeLabel := label.new(bar_index, high + 20, text="Market Change (3 months): " + str.tostring(marketChange, "#.##") + "%", color=color.orange, style=label.style_label_up)
// Both labels (cumulative profit and market change) are displayed simultaneously
var label infoLabel = na
if (not na(cumulativeProfit) and not na(marketChange))
if not na(infoLabel)
label.delete(infoLabel)
infoLabel := label.new(bar_index, high + 30, text="Cumulative Profit: " + str.tostring(cumulativeProfit, "#.##") + "% | Market Change (3 months): " + str.tostring(marketChange, "#.##") + "%", color=color.purple, style=label.style_label_upper_right)