RSI ダイナミッククローズポジションモメンタム取引戦略

1
Follow
1781
Followers
概要
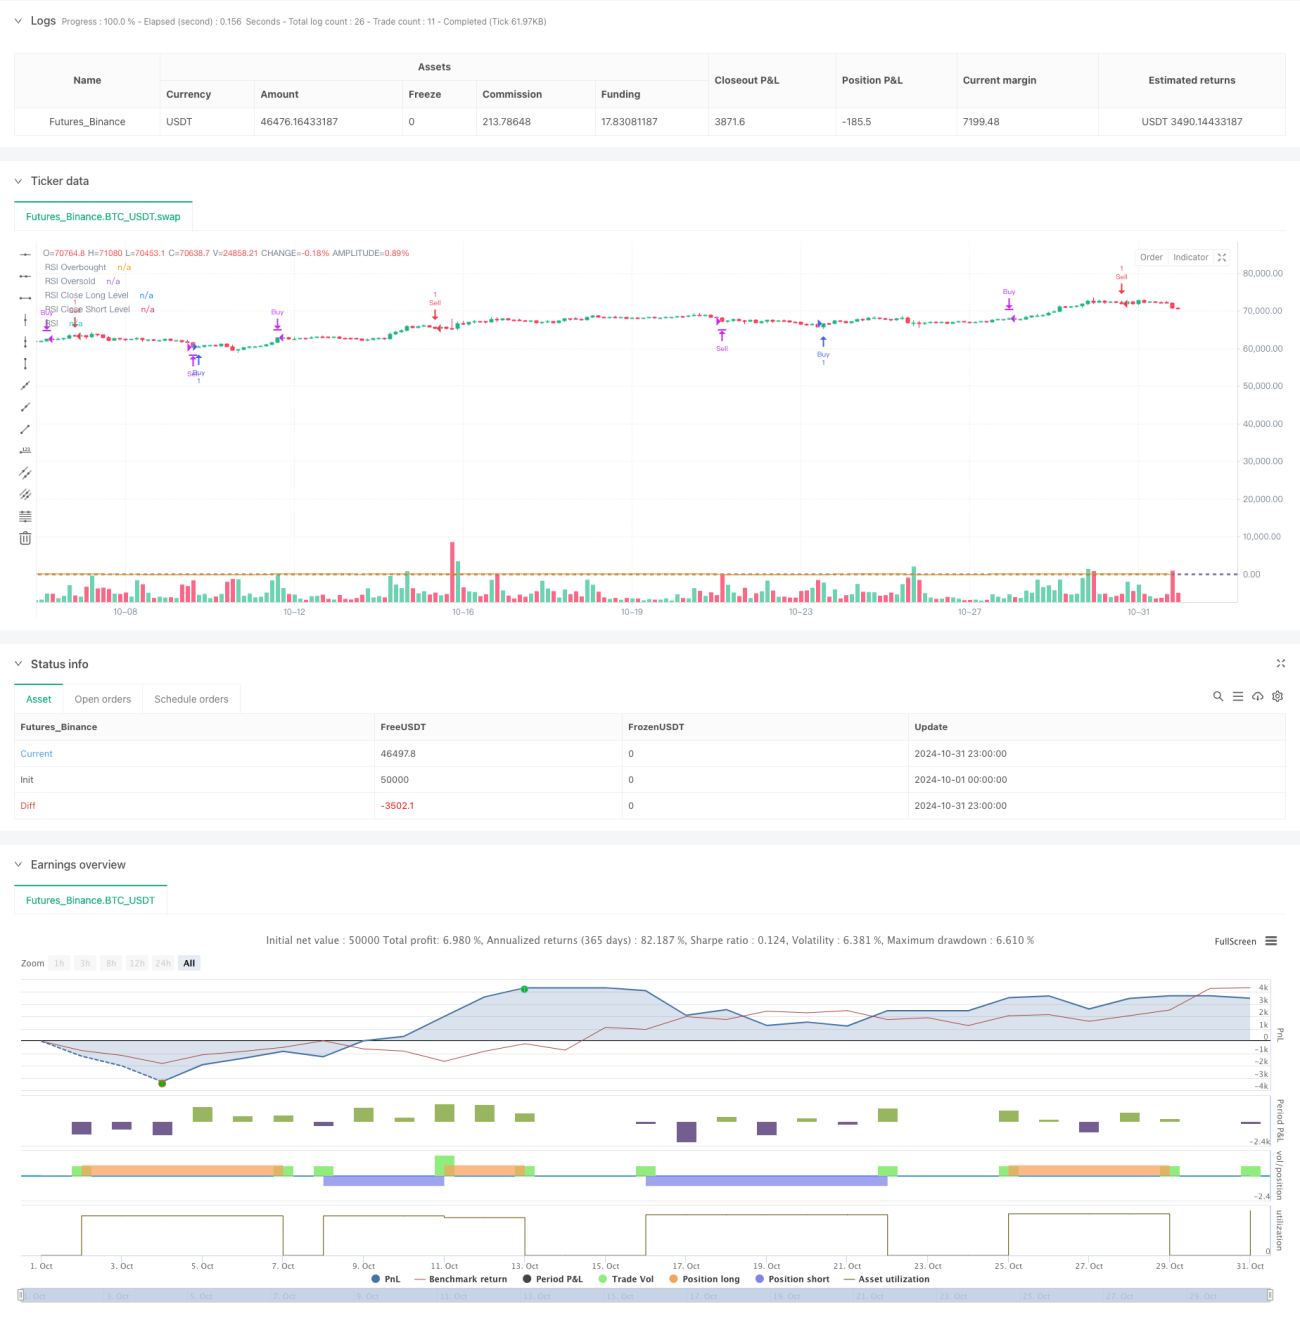
この戦略は,相対的に強い指数 ((RSI)) に基づくダイナミックな平仓戦略で,ダイナミックな開場およびポジション条件を設定して市場トレンドを捕捉する. RSI指標が超買超売りレベルを超えたときに取引シグナルを生成し,異なるRSIレベルの平仓条件を設定して取引パフォーマンスを最適化するユニークなダイナミックな平仓メカニズムを導入する.
戦略原則
戦略の中核となるロジックには、次の主要なコンポーネントが含まれます。
- 信号生成機構: RSI指標の超買い超売りレベル ((70/30) を主要な取引信号として使用する. RSIが上方30を突破すると買取信号が作られ,下方70を突破すると売り信号が作られる.
- ポジション管理システム:戦略は単一ポジションの原則を採用し,いつでも最大1つの方向のポジションのみを保持することを保証し,リスクの開口を効果的に制御する.
- 動的平仓機構:異なるRSI平仓レベルを設定した ((多ポジション60/空ポジション40),この非対称な設計は,市場傾向特性によりよく適応する.
- ビジュアル化モジュール: RSIライン,超買超売レベル,平仓レベルをグラフに描き出すことにより,トレーダーが市場状態を直観的に理解するのを助ける.
戦略的優位性
- システム化された取引: 戦略は完全にシステム化され,主観的な判断による感情的な干渉は排除されます.
- リスク管理:単一ポジションの原則とダイナミック平仓メカニズムにより,リスクを効果的に管理する.
- 適応性:RSIのパラメータとポジションレベルを異なる市場の特徴に応じて調整できます.
- 双方向取引:上昇と下落の両方の市場での取引の機会を得ることができます.
- ビジュアルサポート:直観的なグラフ表示は,市場状態と戦略の論理を理解するのに役立ちます.
戦略リスク
- 横盤の変動市場では,取引が頻繁になり,取引コストが増加する可能性があります.
- トレンドの継続リスク:早めの平仓により,より大きなトレンドの機会が逃れること.
- パラメータの感受性:戦略のパフォーマンスは,RSIのパラメータとポジションレベルの設定に敏感である.
- スライドインパクト: 市場が急激に波動すると,大きなスライドリスクに直面する可能性があります.
戦略最適化の方向性
- トレンドフィルタを導入: 移動平均などのトレンド指標を追加し,偽信号をフィルターします.
- 動的パラメータ最適化:市場の変動率に応じてRSIパラメータとポジションレベルを自動的に調整する.
- ポジション管理を増やす:資金管理モジュールを導入し,市場リスクに応じてポジションの規模を調整する.
- ポジションの最適化: 利益の保護のために,トラッキング・ストップ・ロスの追加を検討する.
要約する
これは,合理的に設計された動的取引戦略であり,RSI指標と動的平衡メカニズムによって市場機会を捉えます.この戦略の主な特徴は,体系化程度が高く,リスク管理が完善で,適応性が高いことです.いくつかの固有のリスクがあるものの,パラメータの最適化と機能拡張により,戦略には大きな改善の余地があります.安定した取引システムを求める投資家にとって,これは考慮すべき戦略の枠組みです.
Source
Pine
Strategy parameters
Related strategies
Comment
All comments (0)
No data
- 1