クラウドチャートのブレークスルーとストップロスシステムを組み合わせた複数のテクニカル指標のトレンド追跡戦略

1
Follow
1780
Followers
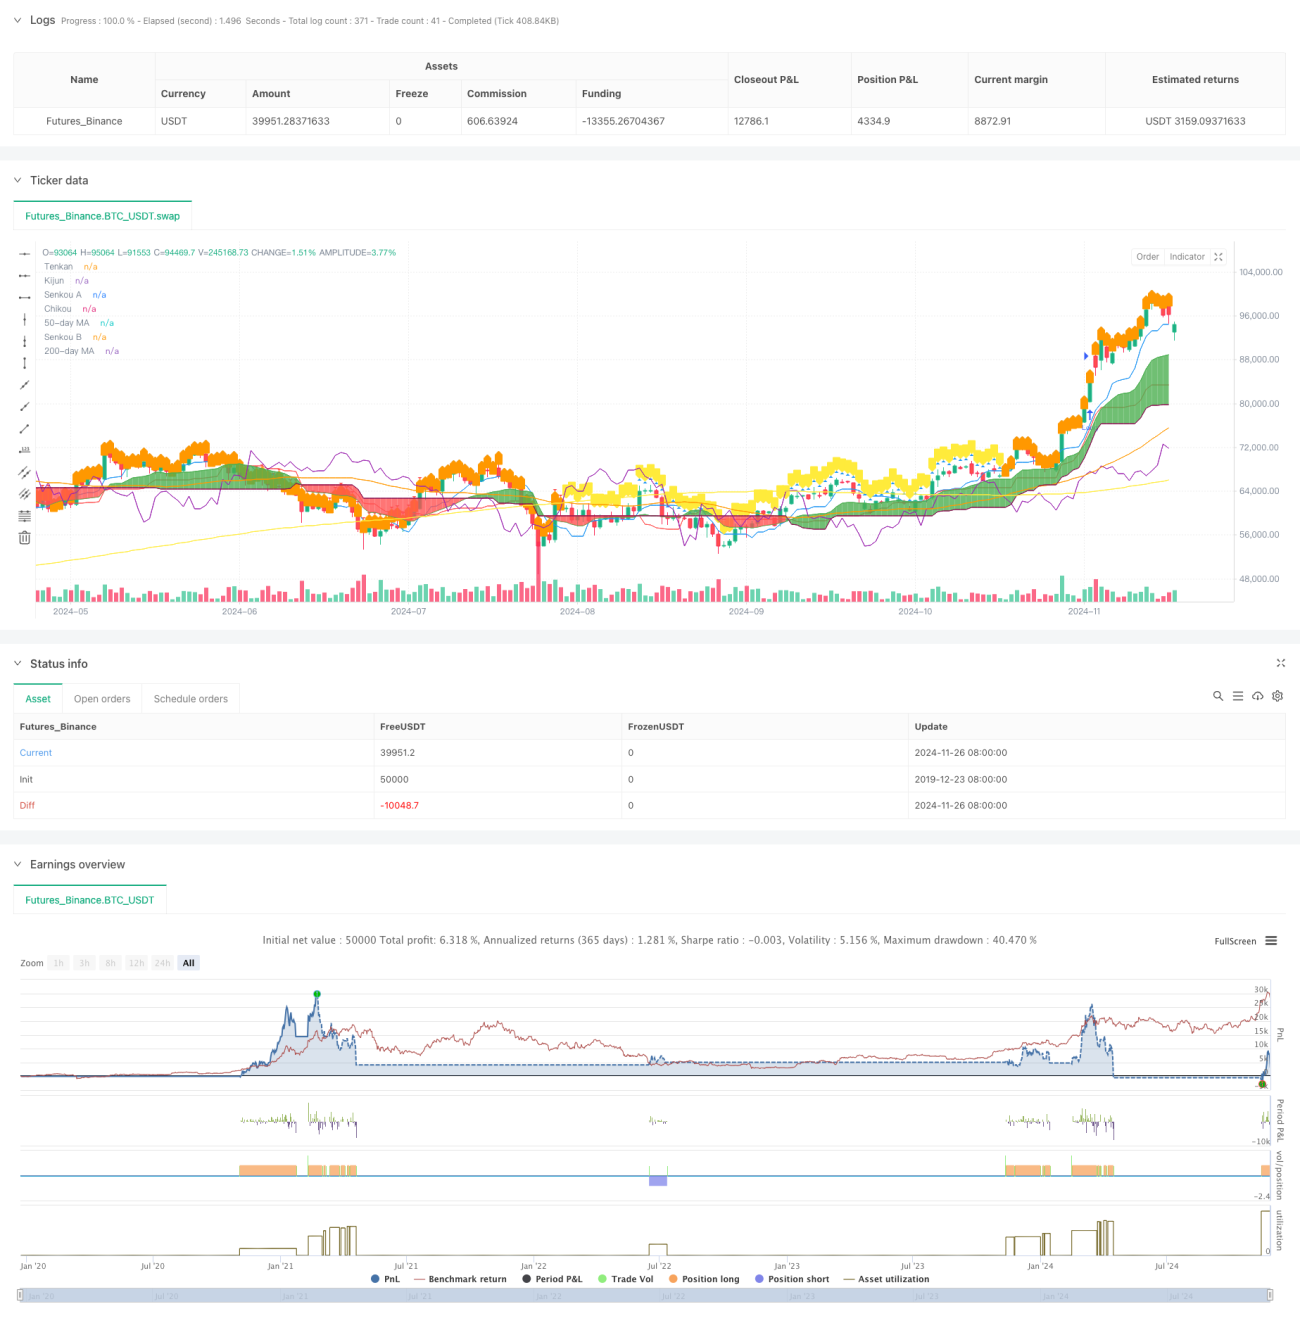
概要
この戦略は,一連の技術指標を組み合わせた完全な取引システムであり,主に一目瞭然のIchimoku Cloud指標に基づいて取引決定を行う.このシステムは,アンテナのTenkanとベースラインのKijunの交差によって入場タイミングを決定し,比較的強い指数 (RSI) と移動平均のMAを補助的なフィルタリング条件として組み合わせている.この戦略は,ダイナミックなストップ・ローズとしてクラウドの構成要素を採用し,完全なリスク制御システムを形成する.
戦略原則
戦略の中核となるロジックは、次の主要な要素に基づいています。
- 入場信号はアンテナと基准線の交差によって生成され,上穿は多信号で,下穿は空白信号で形成される
- 価格の位置と雲の関係 (Kumo) 傾向確認として,価格が雲の上の多し,価格が雲の下の空し
- 50日間の移動平均と200日間の移動平均の位置関係がトレンドフィルター条件として
- 周回RSIは市場の強弱を確認し,偽信号をフィルターする
- 雲層の上下境界を動的ストップロージャとして使用し,リスクの動的管理を実現する.
戦略的優位性
- 複数の技術指標の組み合わせにより,より信頼性の高い取引信号が提供され,偽信号の影響が著しく減少しました.
- ダイナミックなストップポイントとしてクラウドグラフを使用し,市場の波動に応じて自動的にストップポジションを調整し,利益を保護し,価格に十分な波動空間を与えることができます.
- 周回 RSI フィルタリングにより,過剰な超買いと超売り領域での不利な取引を効果的に回避します.
- 移動平均の交差は,トレンドの確認と取引の成功率を高めます.
- 入場,保有,出場の各節を含む完全なリスク管理システム
戦略リスク
- 複数の指標をフィルタリングすると,潜在的に良い機会を逃してしまう可能性があります.
- 不安定な市場では、誤ったブレイクアウトシグナルが頻繁に発生する可能性がある
- クラウドグラフの指標自体は遅滞しており,入学時期に影響を及ぼす可能性がある.
- ダイナミックなストップは,急激に波動する市場において,過度に緩やかになる可能性があります.
- 過剰なフィルタリング条件は,取引機会の減少につながり,戦略の全体的な利益に影響を与える可能性があります.
戦略最適化の方向性
- 波動率指標を導入し,市場の波動に応じて戦略パラメータを調整する
- 異なる市場環境に適したクラウドマップのパラメータ設定を最適化
- 取引量分析と信号の信頼性を向上させる
- タイムフィルタリングを導入し,波動的な時間帯を避けます.
- 戦略の動的調整を実現する自己適応のパラメータ最適化システムを開発
要約する
この戦略は,複数の技術指標を組み合わせて,完全な取引システムを構築している. この戦略は,信号の生成に注力するだけでなく,完全なリスク制御機構も含んでいる. 複数のフィルタリング条件の設定により,取引の成功率を効果的に向上させている. 同時に,ダイナミックな止損設計は,戦略に良好なリスク/利益の比率も提供している. いくつかの最適化の余地があるが,全体的には構造が整った,論理的に明確な戦略システムである.
Source
Pine
Strategy parameters
Related strategies
Comment
All comments (0)
No data
- 1