T3 移動平均トレンド追跡と移動ストップロス定量取引戦略

1
Follow
1781
Followers
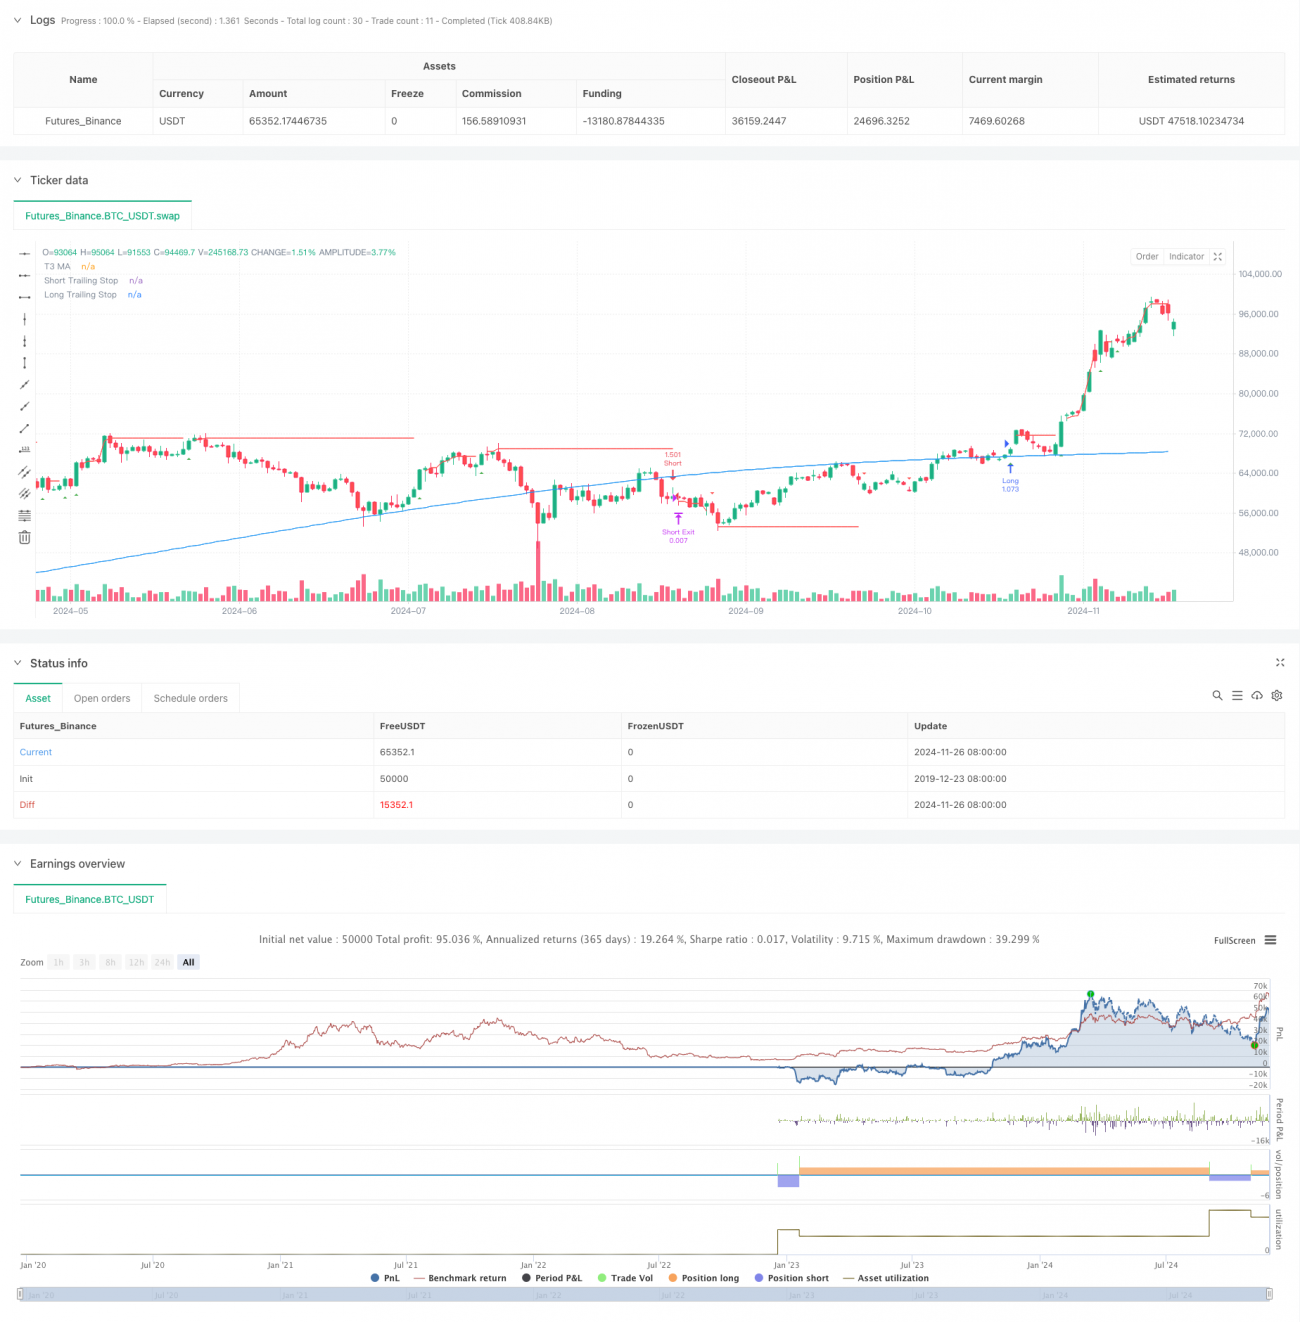
概要
この戦略は,T3平均線,トレンド追跡,移動ストップの仕組みを組み合わせた総合的な定量取引システムである.戦略は,T3移動平均線を介して市場のトレンド方向を識別し,レモントレンド指数とTDFI指数を使用してシグナルを確認し,移動ストップと固定ストップを組み合わせたリスク管理システムと連携し,トレンドの把握とリスクを効果的に制御する.
戦略原則
この戦略の核心には,トレンド識別,シグナル確認,リスク管理の3つの主要な部分が含まれています. まず,T3移動平均を主要なトレンド識別ツールとして使用し,T3平均は6倍指数移動平均を計算することで,落差を効果的に軽減し,平滑性を維持できます.次に,レモントレンド指数を使用して価格変動区間を計算し,TDFI指数と組み合わせてシグナルをフィルターし,価格が波動区間を突破し,TDFI指数が確認された場合にのみ取引シグナルが生成されます.最後に,戦略は,移動ストップと固定ストップを組み合わせた方法でリスク管理し,移動ストップは価格がアクティブピークに達した後に追跡し,固定ストップを保護メカニズムとして保持します.
戦略的優位性
- 複数の信号確認メカニズムにより取引の精度が向上
- T3平均線の使用により,偽突破の影響が軽減される.
- 柔軟なリスク管理システムで,利益を守る一方で,トレンドに十分な余地を与える
- 部分的なポジション停止をサポートし,利益の段階的な還元を実現します.
- パラメータは,異なる市場環境に応じて最適化するために,調整可能である
戦略リスク
- T3平均線計算は複雑で,計算の遅延がある可能性があります.
- 複数のシグナルの確認により,いくつかの取引機会を逃す可能性があります.
- 移動停止は,急激な波動で過早に発動する可能性があります.
- 価格の変動が大きくなり,効果的信号が作られる.
- 横盤市場では頻繁に偽信号が生じる可能性がある
戦略最適化の方向性
- 波動率指標の導入と移動停止パラメータの調整
- 市場環境認識モジュールを追加し,異なる市場条件で異なるパラメータを使用
- TDFI指標の計算周期を最適化し,信号のタイムリー性を向上させる
- 通信量要素を追加することを検討する
- 適応した部分停止比率設定機構の研究
要約する
これは,複数の技術指標の配合使用によって,取引信号の信頼性を保証するとともに,効果的なリスク管理を実現する,設計された包括的なトレンド追跡戦略である.戦略のモジュール化された設計は,中長期トレンド追跡システムの基礎の枠組みとして適した拡張性と最適化スペースを備えている.実際のアプリケーションでは,特定の取引品種と市場環境に応じてパラメータの最適化調整が推奨されている.
Source
Pine
/*backtest
start: 2019-12-23 08:00:00
end: 2024-11-27 00:00:00
period: 1d
basePeriod: 1d
exchanges: [{"eid":"Futures_Binance","currency":"BTC_USDT"}]
*/

//@version=5
strategy("Lemon Trend Strategy", overlay=true, initial_capital=10000, default_qty_type=strategy.percent_of_equity, default_qty_value=100)

// Input parametersStrategy parameters
Related strategies
Comment
All comments (0)
No data
- 1