毎日の高値と安値とマルチタイムフレームEMAトレンドの定量取引戦略を組み合わせた

1
Follow
1780
Followers
概要
これは日線高低点突破と多周期EMAトレンドを組み合わせた量的な取引戦略である.戦略は,主に,前日の高低点に対する価格の突破を監視し,EMA平均線と資金流向指標 ((CMF)) と組み合わせて取引タイミングを判断する.戦略は,時線と日線の両時間の周期200周期EMA平均線を同時に使用し,複数の技術指標の検証によって取引の正確性を向上させる.
戦略原則
戦略の中核となるロジックには、次の重要な要素が含まれます。
- request.security関数を使用して,前日の最高値と最低値をキーサポートレジスタンス位として取得します.
- 24周期EMA平均線と組み合わせて,トレンド判断の基準線となる.
- CMF ((20サイクル) を取引量と価格の総合指標として導入し,市場資金流動を判断する.
- 同時に,現在の時間周期と1時間周期の200平均線を計算し,より大きな周期の傾向方向を判断する.
取引の具体的ルールは以下の通りです.
複数の条件: 価格が1日前の高値を破り + 閉店価格がEMAの上 + CMFが正値
空白条件: 価格が1日前の低点を下回る + 閉店価格がEMA以下 + CMFがマイナスになる
平仓条件:多時価格がEMAを下回り,空時価格がEMAを破る
戦略的優位性
- 複数の技術指標の統合検証により取引の信頼性が向上
- マルチタイムサイクル分析により,市場動向をより全面的に把握できます.
- CMFの指標と価格の関係により,市場における資金状況の判断が得られます.
- 市場参加者の取引習慣に適合する,前日の高低値をキー価格として使用する
- 戦略ロジックは明確で、理解しやすく、実行しやすい
- 明確な入場・出場条件があり,主観的な判断を減らす
戦略リスク
- 市場が揺れ動いている時,誤った信号が頻繁に発生する可能性があります.
- 価格の突破に反応しない
- 重要な場所での取引機会を逃す可能性
- より大きな周期を考慮しない傾向環境
- 市場が急激に波動する時には,より大きな引き下がりが起こりうる.
リスク管理の提案:
- 合理的なストップポジションを設定する
- 異なる市場状況に応じてパラメータを調整する
- トレンドフィルターを追加
- 波動率指標の追加を検討する
戦略最適化の方向性
- 適応型パラメータ最適化メカニズムの導入
- 市場環境のフィルタリング条件を増やすこと
- ストップ・ダメージとストップ・メカニズムを最適化
- 市場環境により変動する指数
- 位置管理メカニズムへの参加を検討
- 取引量分析の指標を増やす
要約する
これは,複数の技術指標と複数の時間周期分析を組み合わせた完全な取引システムである.戦略は,日中の高低突破,平均線トレンドと資金の流れの総合的な分析によって取引機会を探している.一定のリスクがあるものの,合理的なリスク管理と継続的な最適化改善により,この戦略は良い応用価値を持っています.
Source
Pine
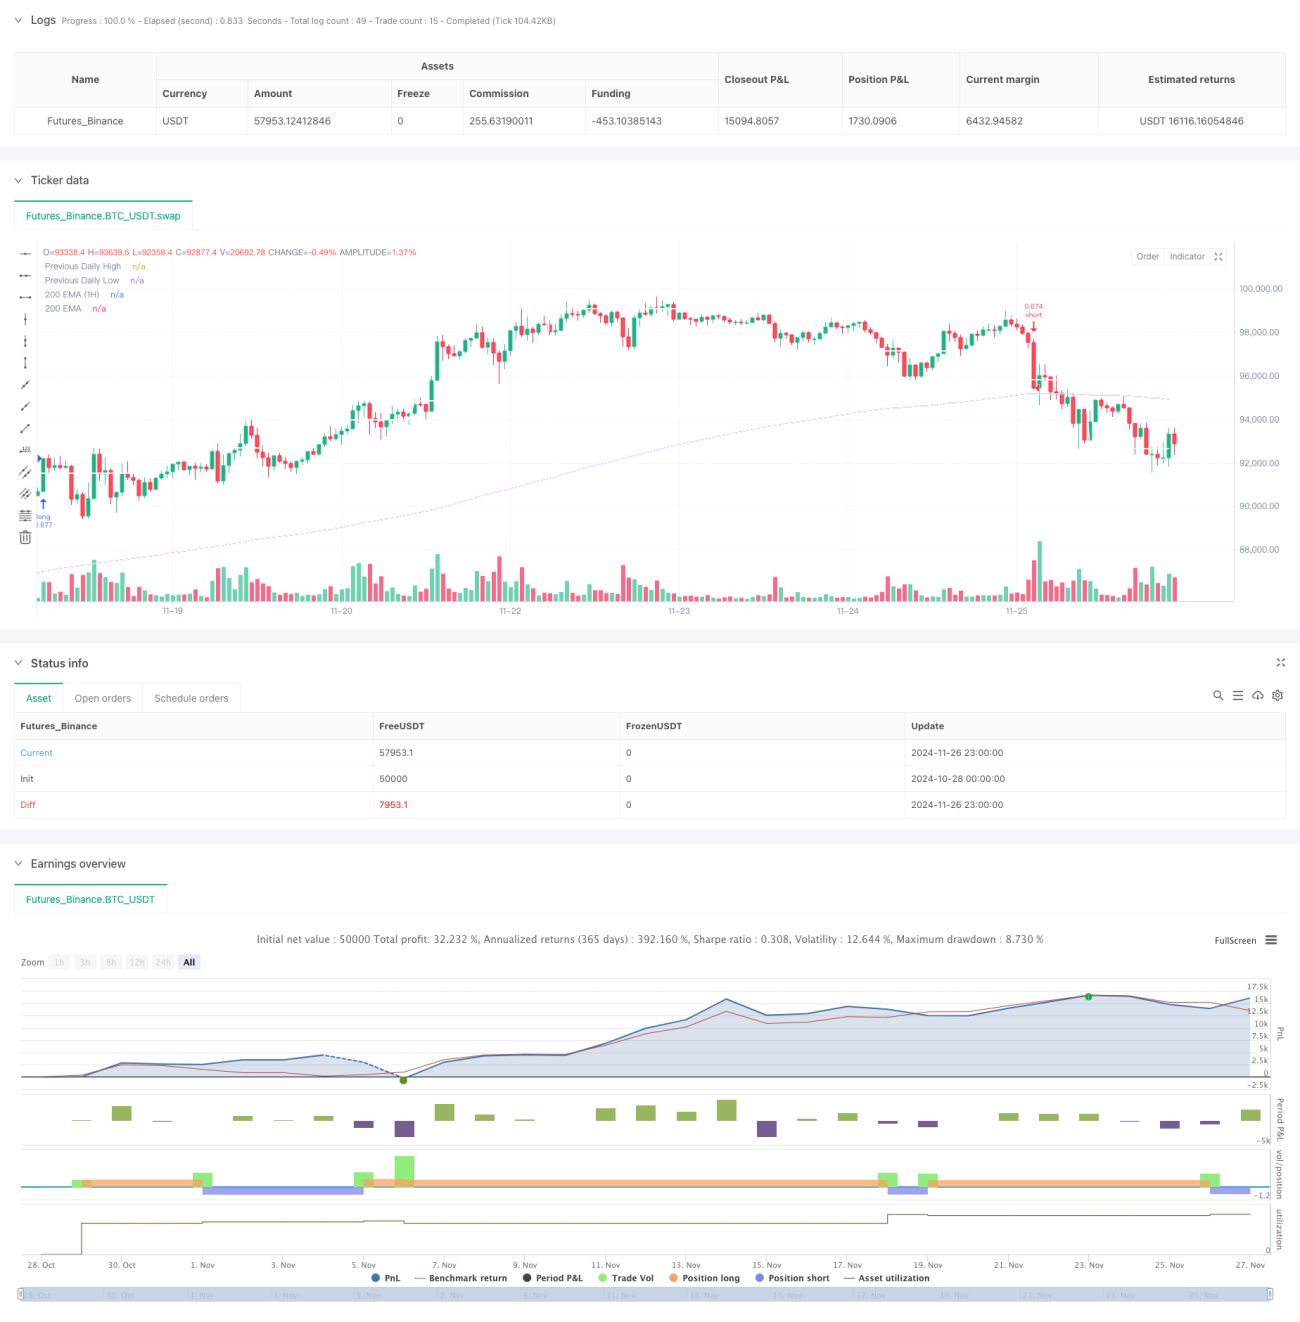
/*backtest
start: 2024-10-28 00:00:00
end: 2024-11-27 00:00:00
period: 1h
basePeriod: 1h
exchanges: [{"eid":"Futures_Binance","currency":"BTC_USDT"}]
*/

//@version=5
strategy(title='The security Daily HIGH/LOW strategy', overlay=true, initial_capital=10000, calc_on_every_tick=true,
         default_qty_type=strategy.percent_of_equity, default_qty_value=100,
commission_type=strategy.commission.percent, commission_value=0.1)Strategy parameters
Related strategies
Comment
All comments (0)
No data
- 1