
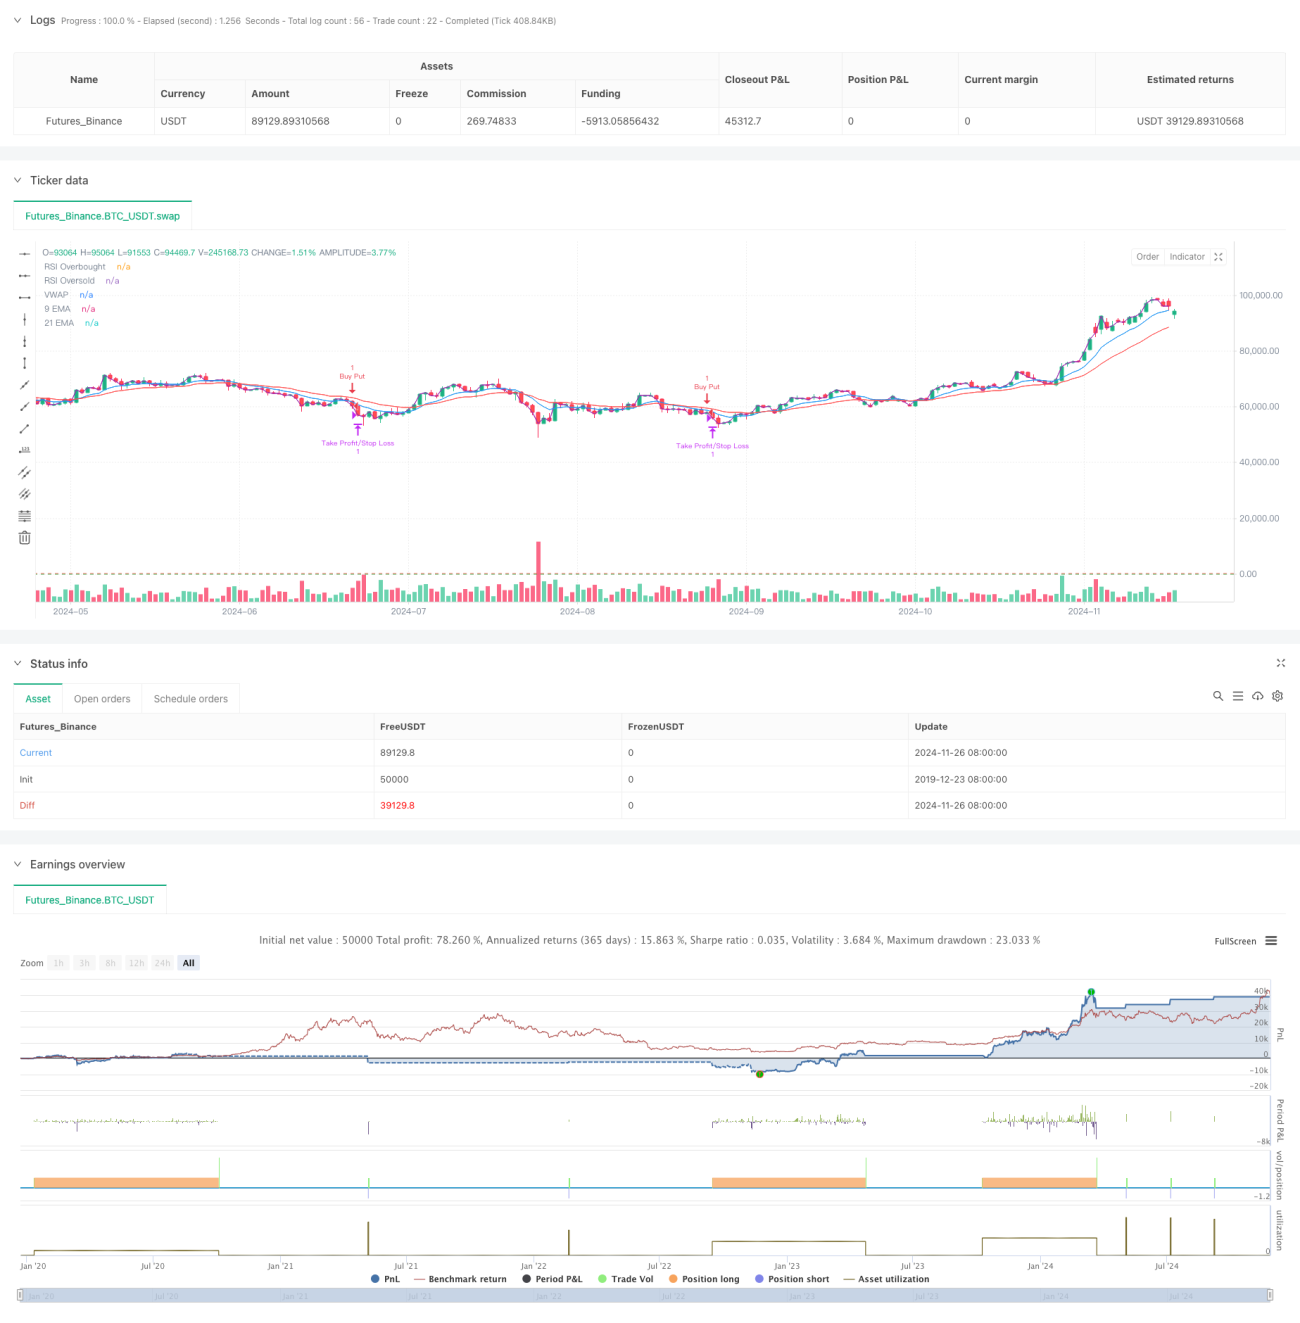
この戦略は,複数の技術指標に基づいた高周波取引システムで,5分間の時間枠で,均線システム,動向指標,取引量分析を組み合わせている. この戦略は,ダイナミックな調整の方法で市場の波動に適応し,取引の正確性と信頼性を高めるために複数のシグナル認証を使用する. この戦略の核心は,多次元的な技術指標の組み合わせによって短期市場の傾向を捉え,同時に,ダイナミックなストップロースを使用してリスクを制御することです.
戦略は,二重均線システム ((9サイクルと21サイクルEMA) を主要なトレンド判断ツールとして採用し,RSI指標と組み合わせて動量確認を行う.価格が二重均線上にあり,RSIが40-65の範囲にあるとき,システムは多取引の機会を探し,価格が二重均線下にあり,RSIが35-60の範囲にあるとき,システムは空取引の機会を探し.また,戦略は,取引量確認機構を導入し,現在の取引量は20サイクル移動平均取引量の1.2倍以上の取引量を必要としている.VWAPの使用は,取引方向が日中の主要トレンドと一致することをさらに保証する.
この戦略は,複数の技術指標の組み合わせを用いて,比較的完全な取引システムを構築している.戦略の優点は,その多次元的な信号確認機構と動的なリスク管理方法にある.いくつかの潜在的リスクがあるにもかかわらず,合理的なパラメータの最適化とリスク管理により,戦略は,依然として優れた応用価値を有している.
/*backtest
start: 2019-12-23 08:00:00
end: 2024-11-27 00:00:00
period: 1d
basePeriod: 1d
exchanges: [{"eid":"Futures_Binance","currency":"BTC_USDT"}]
*/
//@version=5
strategy("Optimized Nifty MidCap Select Options 5-min Intraday Strategy", overlay=true)
// Parameters
emaShortPeriod = input.int(9, title="Short EMA")
emaLongPeriod = input.int(21, title="Long EMA")
rsiPeriod = input.int(14, title="RSI Period")
rsiOverbought = input.int(65, title="RSI Overbought Level") // More conservative than 70
rsiOversold = input.int(35, title="RSI Oversold Level") // More conservative than 30
atrLength = input.int(14, title="ATR Length")
atrMultiplier = input.float(1.5, title="ATR Multiplier")
volumeMultiplier = input.float(1.2, title="Volume Multiplier") // For confirming high-volume trades
// EMA Calculation
emaShort = ta.ema(close, emaShortPeriod)
emaLong = ta.ema(close, emaLongPeriod)
// RSI Calculation
rsiValue = ta.rsi(close, rsiPeriod)
// ATR Calculation
atrValue = ta.atr(atrLength)
// VWAP Calculation
vwapValue = ta.vwap(close)
// Volume Check
volumeCondition = volume > ta.sma(volume, 20) * volumeMultiplier
// Define long and short conditions
// Long Condition:
// Price above both EMAs, RSI not overbought, price above VWAP, and high volume
longCondition = (close > emaShort) and (close > emaLong) and (rsiValue > 40 and rsiValue < rsiOverbought) and (close > vwapValue) and volumeCondition
// Short Condition:
// Price below both EMAs, RSI not oversold, price below VWAP, and high volume
shortCondition = (close < emaShort) and (close < emaLong) and (rsiValue < 60 and rsiValue > rsiOversold) and (close < vwapValue) and volumeCondition
// Entry logic
if (longCondition)
strategy.entry("Buy Call", strategy.long)
if (shortCondition)
strategy.entry("Buy Put", strategy.short)
// Dynamic Take Profit and Stop Loss based on ATR
takeProfitLevel = strategy.position_avg_price * (1 + atrValue * atrMultiplier / 100)
stopLossLevel = strategy.position_avg_price * (1 - atrValue * atrMultiplier / 100)
// Exit strategy based on ATR levels
strategy.exit("Take Profit/Stop Loss", from_entry="Buy Call", limit=takeProfitLevel, stop=stopLossLevel)
strategy.exit("Take Profit/Stop Loss", from_entry="Buy Put", limit=takeProfitLevel, stop=stopLossLevel)
// Plotting indicators
plot(emaShort, title="9 EMA", color=color.blue)
plot(emaLong, title="21 EMA", color=color.red)
hline(rsiOverbought, "RSI Overbought", color=color.red)
hline(rsiOversold, "RSI Oversold", color=color.green)
plot(vwapValue, title="VWAP", color=color.purple)