二重移動平均 MACD クロス日付調整可能な定量取引戦略

1
Follow
1780
Followers
概要
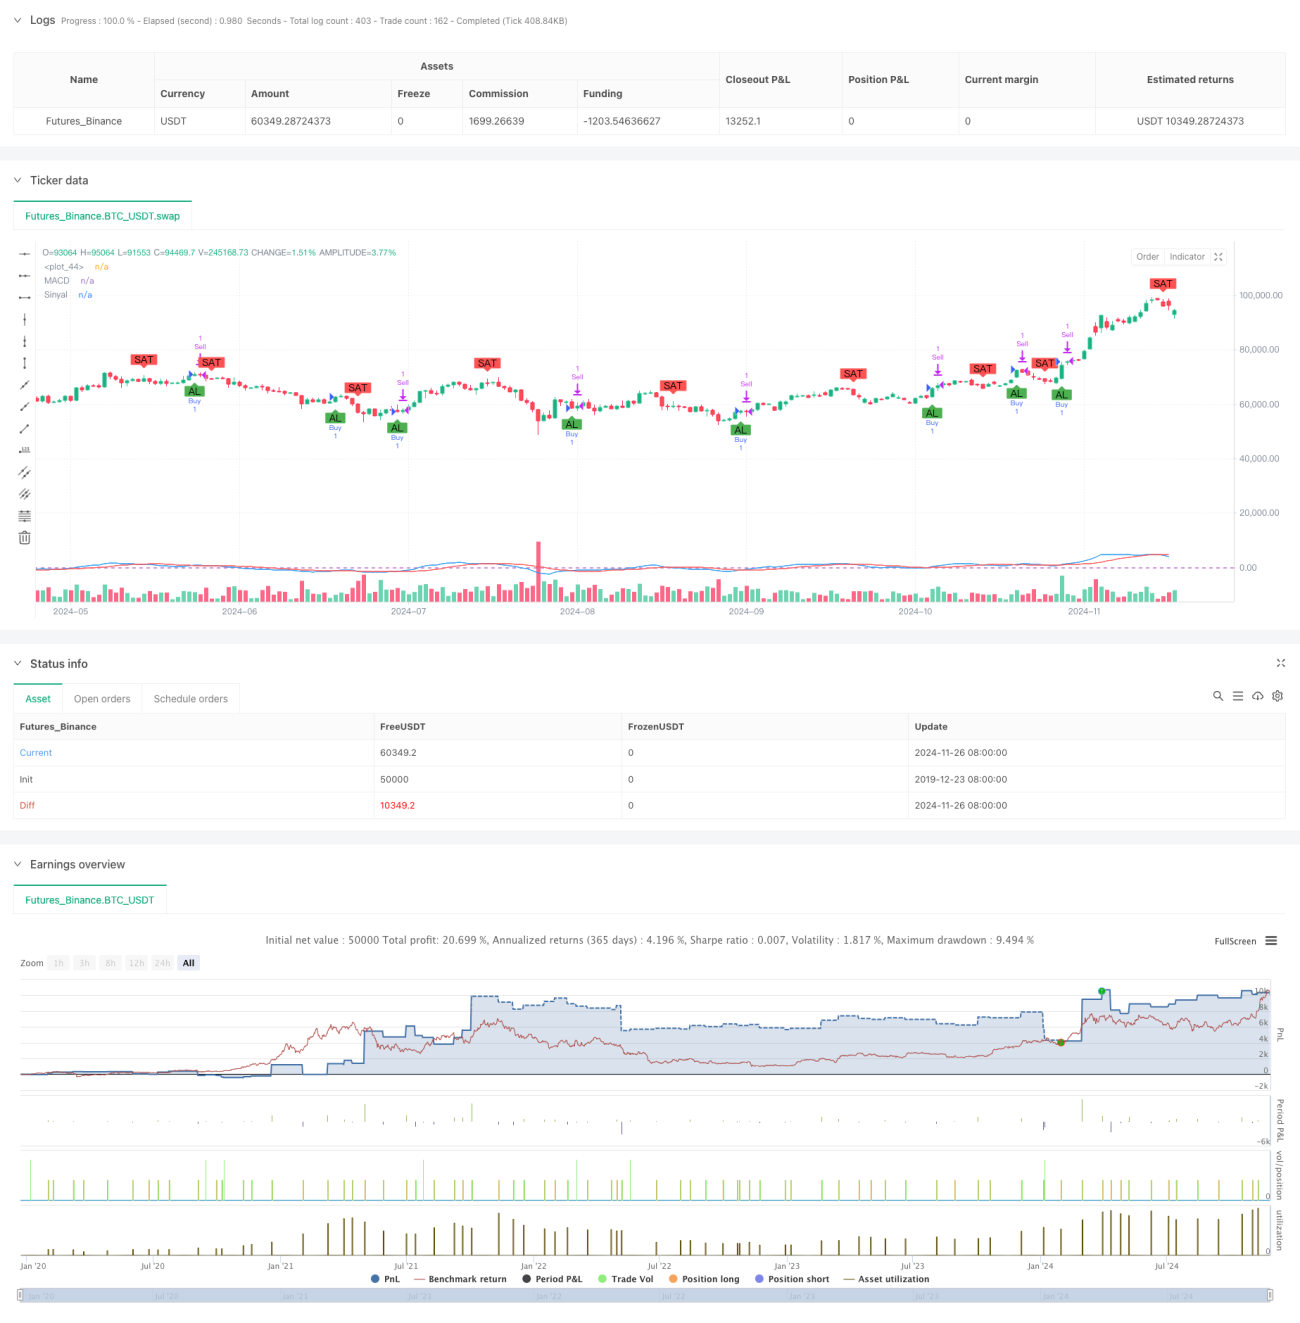
これは,MACD指数に基づく量的な取引戦略で,特定の時間帯を設定して取引を行う.戦略の核心は,高速と遅い移動平均を使用してMACD値を計算し,信号線との交差で購入や売却のタイミングを決定する.戦略には,リスクを制御し,利益をロックするためのストップ・ロスとストップ・ストップのメカニズムも含まれている.
戦略原則
戦略は8周期と16周期のインデックス移動平均 (EMA) を使ってMACD値を計算し,11周期の簡易移動平均 (SMA) を信号線として使用する.MACD線上の信号線を横切るときに買い信号を生じ,下を通るときに売る信号を生じする.同時に,戦略は1%のストップ損失と2%のストップストップの設定を導入し,ユーザが指定した時間枠でのみ取引を行う.
戦略的優位性
- タイムフレキシビリティ:タイムスケープパラメータにより,ユーザーは戦略の実行周期を正確に制御することができ,特定の期間の反測とリアルタイム取引を行うことができます.
- リスク管理の改善: ストップ・ローズ・ストップ・メカニズムを統合し,単一取引のリスク露出を効果的に制御する.
- パラメータの調整性:主要指標のパラメータは,速慢平均線周期,信号線周期および止損停止比率を含む調整可能です.
- 信号明晰:MACD交差に基づく取引信号は明瞭で,実行し,監視しやすい.
戦略リスク
- 遅滞リスク:均線システムを使用しているため,信号は遅滞しており,最適なエントリーポイントを逃す可能性があります.
- 振動市場リスク:横盤振動市場では,頻繁に偽信号が生じ,過度な取引を引き起こす可能性があります.
- 固定ストップリスク: 固定パーセンテージストップを使用することは,異なる市場環境にうまく適応しない可能性があります.
- 時間の依存性:戦略の効果は,特定の時間帯の市場特性に影響され,すべての期間に安定したパフォーマンスを保証することは困難である.
戦略最適化の方向性
- トレンドフィルターの導入: 長期周期平均線またはATR指標をトレンド確認として追加し,偽信号を減らす.
- ダイナミック・ストップ・メカニズム:ATRまたは波動率を使用してダイナミック・ストップ・ポイントを設定し,ストップの適応性を向上させる.
- 信号確認の最適化:信号の有効性を確認するために,取引量,RSIなどの補助指標を追加できます.
- タイムサイクル最適化:信号信頼性を高めるため,複数のタイムサイクル分析を追加することを推奨する.
- ポジション管理の改善:変動率に基づくダイナミックなポジション管理システムを導入することができる.
要約する
これは,構造が整った,論理が明確な量化取引戦略である. MACDの交叉によって取引信号を生成し,時間フィルタリングとリスク管理を組み合わせて,実用的な取引システムを形成している. 戦略の調整性が強く,さらなる最適化と個別化調整に適している. 交易者は,実況使用の前に十分な反射を行い,特定の取引品種と市場環境に応じてパラメータを調整することを推奨している.
Source
Pine
/*backtest
start: 2019-12-23 08:00:00
end: 2024-11-27 00:00:00
period: 1d
basePeriod: 1d
exchanges: [{"eid":"Futures_Binance","currency":"BTC_USDT"}]
*/

// This Pine Script™ code is subject to the terms of the Mozilla Public License 2.0 at https://mozilla.org/MPL/2.0/
// © sergengurgen83

//@version=5Strategy parameters
Related strategies
Comment
All comments (0)
No data
- 1