
1
Follow
1780
Followers
概要
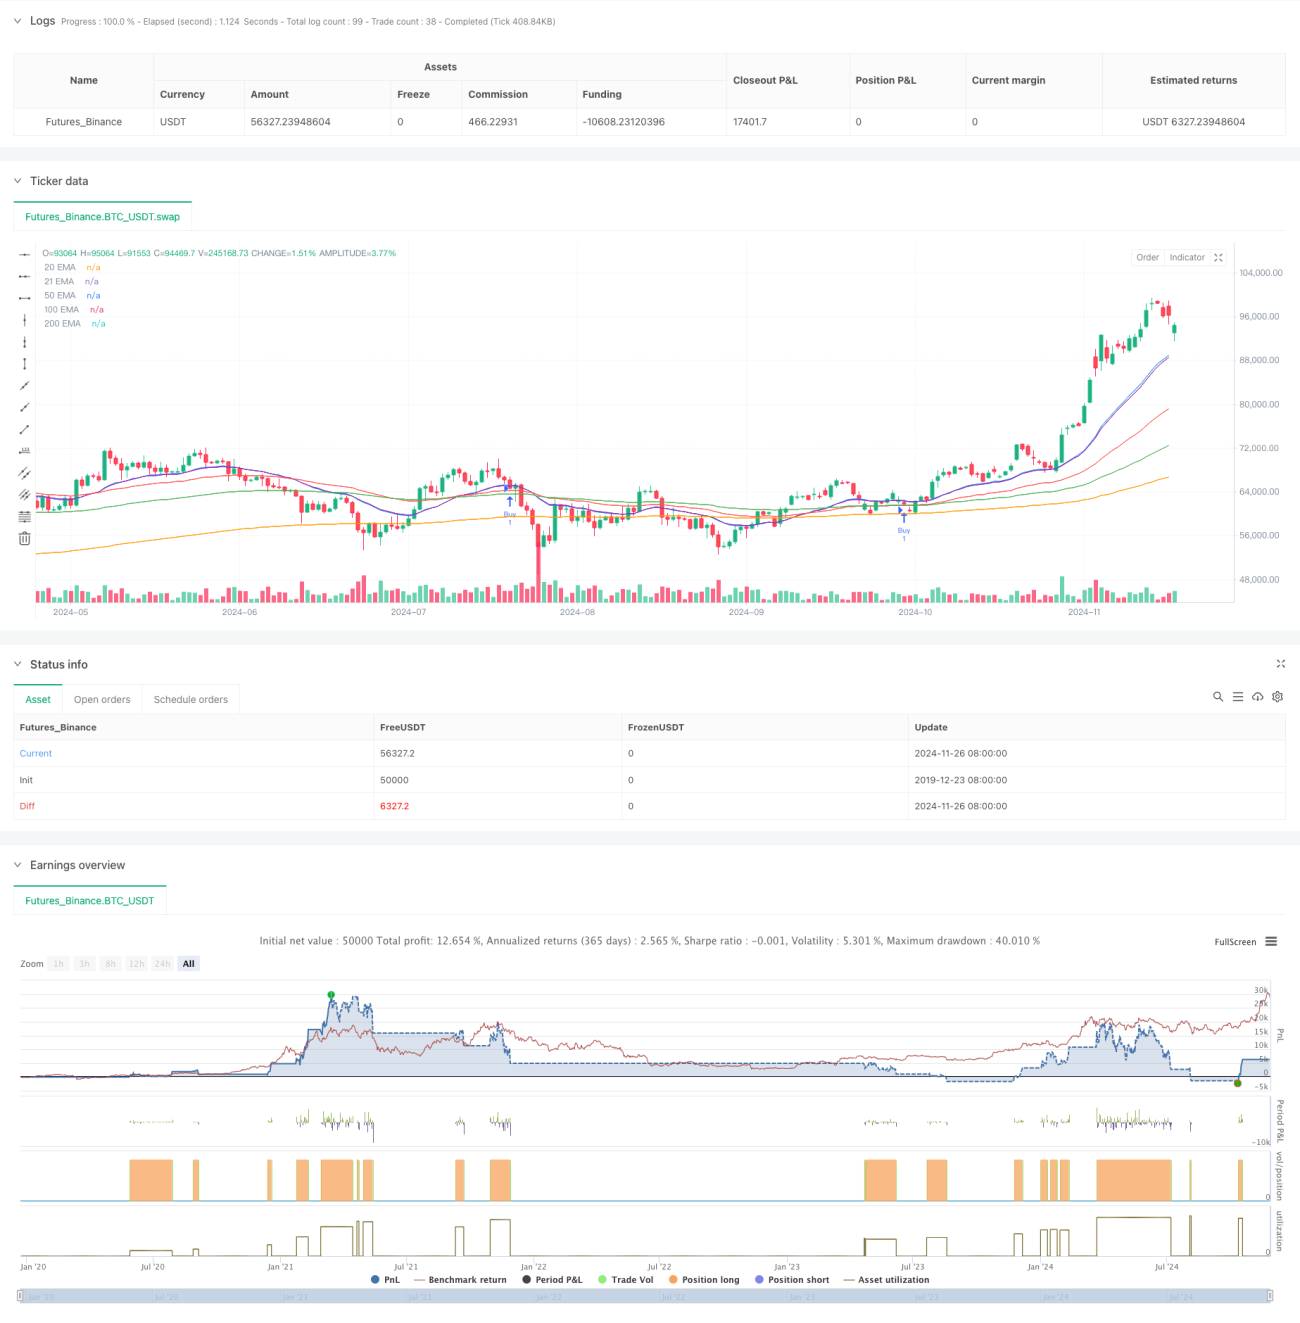
この戦略は,複数の指数移動平均 ((EMA) と実際の波幅指標 ((ATR) に基づくトレンド追跡取引システムである. 戦略は,複数の均線の配列形状を判断することによって,トレンドの方向性を確認し,上昇傾向で回転買い機会を探し,ATRのダイナミクスを利用して止損と利益の目標を設定する. この方法は,トレンド追跡の安定性を保証するとともに,ATRによって市場の変動にダイナミクスの適応を実現する.
戦略原則
戦略の中核となるロジックには、次の重要な要素が含まれます。
- 傾向判断: 20,50,100,および200日指数移動平均を使用して,短期平均線が長期平均線の上にあり,多頭列を呈するときに上昇傾向が確認される.
- 入場条件: 確認されたトレンドに基づいて,価格が21日平均線の近くまで戻るのを待つ (21日平均線と50日平均線の間にある).
- リスク管理:ATRに基づいて動的な止損と利益の目標を設定し,止損は入場価格の1.5倍ATRを減算し,利益の目標は入場価格の3.5倍ATRを足します.
- ポジション管理:単一のポジションモードを採用し,ポジションを保有する際に再入場は行われない.
戦略的優位性
- トレンド確認の仕組みは厳格である:多重平均線の並べ替えによってトレンド確認がされ,偽突破を効果的にフィルタリングすることができる.
- 入場時刻精度:上昇傾向の中で平均線支柱への呼び戻しを待つことで,勝率が向上した.
- リスク管理の柔軟性:ATRの動的な設定により,市場の変動に応じて自動的に調整できるストップ・ロズとリターンの設定.
- 実行論理の明晰さ: 策略のルールは明確で,理解し実行しやすい.
- 適応性:異なる市場環境と取引品種に適用できます.
戦略リスク
- 振動市場リスク:横盤振動市場では,頻繁にストップをトリガーすることがあります.
- スリッページリスク: 市場が激しく変動すると、大きなスリッページが発生する可能性があります。
- トレンド反転リスク: トレンド反転時に大きな引き下がりが起こりうる.
- 参数感性:平均線周期とATR倍数の選択は,戦略のパフォーマンスに著しく影響する.
戦略最適化の方向性
- 市場環境のフィルタを追加: ADXなどのトレンド強度指標を追加し,強いトレンド市場での取引を行うことができます.
- ポジション管理の最適化:トレンドの強さに応じてポジションの規模を動的に調整できます.
- ストップ・メカニズムを改良: ストップ・トラッキングを支柱位置設定と組み合わせることができる.
- 出場メカニズムの追加: 出場を早める条件としてトレンド反転シグナルを追加できます.
- パラメータ自律性:市場波動周期の動態に応じて平均線パラメータを調整することができる.
要約する
これは,構造的に整った,論理的に厳格なトレンド追跡戦略である. 多重平均線によるトレンド確認,リターン入場,ATRのダイナミックリスク管理の組み合わせにより,戦略の安定性も確保され,優れた適応性も備えている. いくつかの固有のリスクがあるにもかかわらず,推奨された最適化の方向によって,戦略の安定性と収益性をさらに向上させることができる. この戦略は,中長期のトレンドを追跡するのに特に適しており,トレンド市場で安定した収益を期待するトレーダーにとって良い選択である.
Source
Pine
Related strategies
Comment
All comments (0)
No data
- 1