
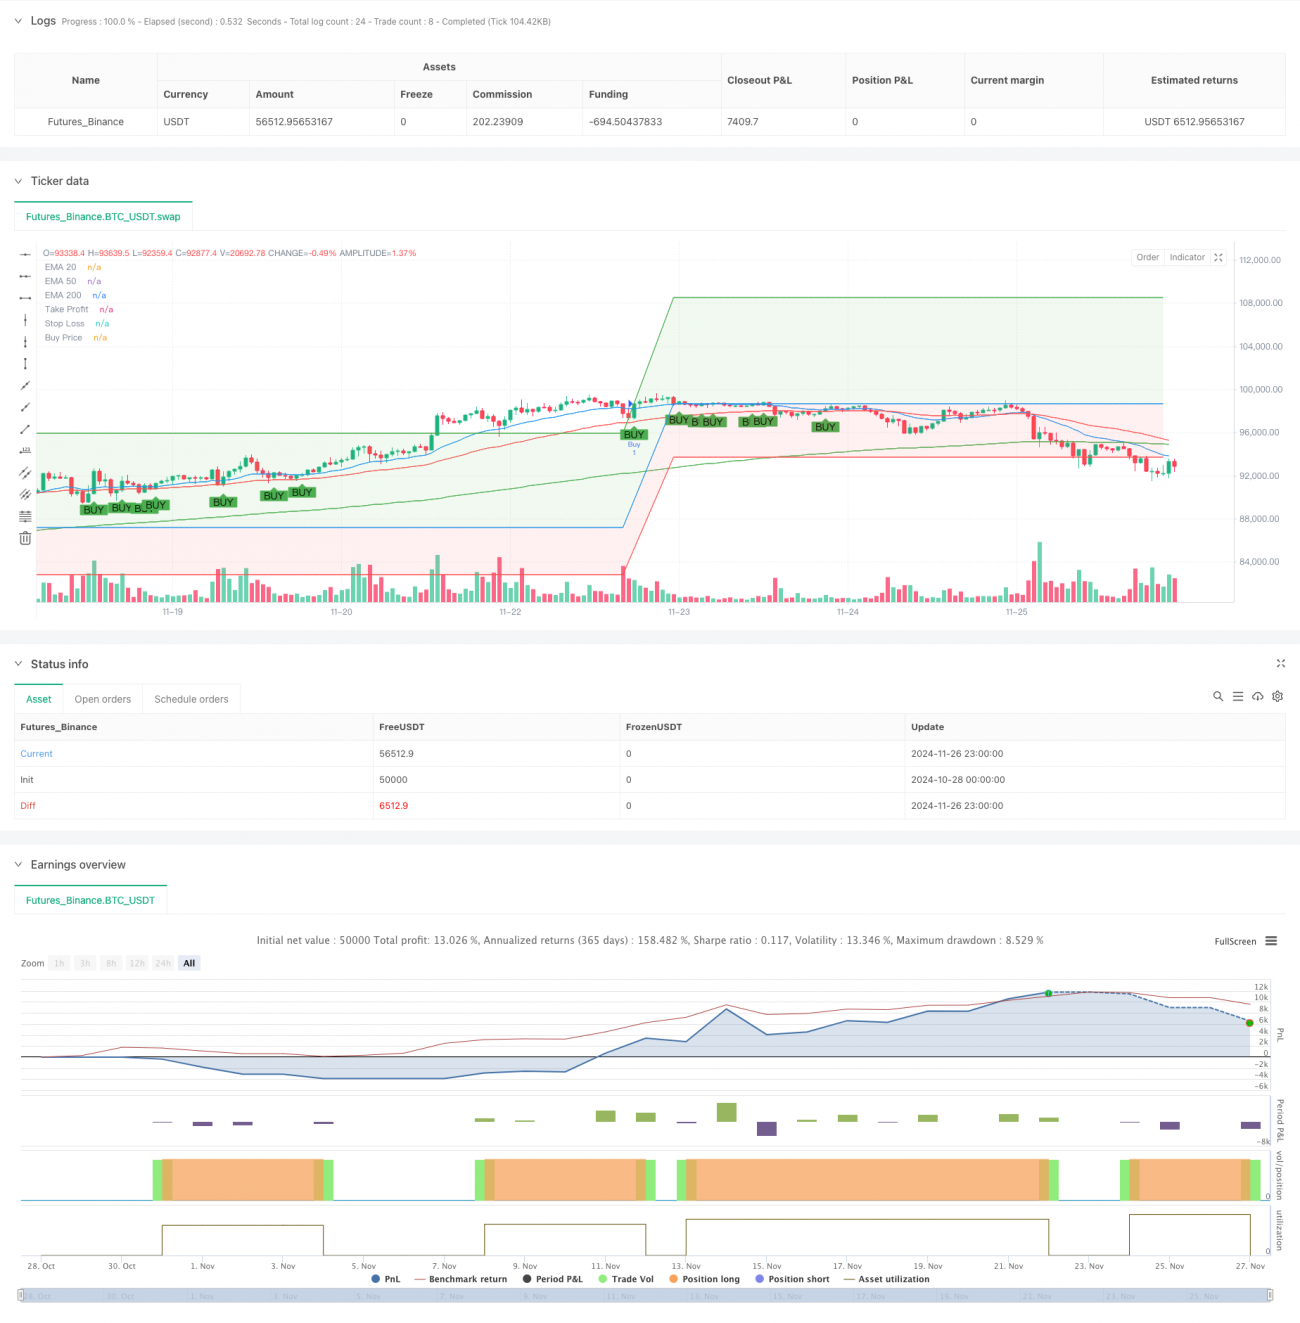
これは,多周期平均線交差に基づくトレンド追跡戦略である.この戦略は,主に20,50および200周期指数移動平均 ((EMA)) の交差関係と価格と平均線の関係に基づいて入場タイミングを判断し,リスクを管理するためにパーセントベースのストップ・ストップ・ロスを設定する.この戦略は,特に1時間,日線,週線グラフなどの大きな時間周期に適しており,中長期のトレンド傾向を効果的に捉える.
戦略の核心的な論理は,多重平均線システムと価格行動分析に基づいています.
これは合理的で論理的に明確なトレンド追跡戦略である.複数の技術指標の組み合わせによる戦略の信頼性が保証され,明確なリスク管理方案も提供されている.戦略は,特に大周期図で動作するのに適しており,中長期のトレンドを把握する上で独特な利点がある.提案された最適化方向によって,戦略はさらに向上している.トレーダーは,現場で使用する前に,フィットバックシステムで充分にテストし,特定の取引品種の特性に応じてパラメータを適切に調整することを推奨している.
/*backtest
start: 2024-10-28 00:00:00
end: 2024-11-27 00:00:00
period: 1h
basePeriod: 1h
exchanges: [{"eid":"Futures_Binance","currency":"BTC_USDT"}]
*/
//@version=5
strategy("EMA Cross Strategy with Targets and Fill", overlay=true)
// Define EMAs
ema20 = ta.ema(close, 20)
ema50 = ta.ema(close, 50)
ema200 = ta.ema(close, 200)
// Plot EMAs (hidden)
plot(ema20, color=color.blue, title="EMA 20", display=display.none)
plot(ema50, color=color.red, title="EMA 50", display=display.none)
plot(ema200, color=color.green, title="EMA 200", display=display.none)
// Define the conditions
priceCrossAboveEMA20 = ta.crossover(close, ema20)
priceCloseAboveEMA20 = close > ema20
ema20AboveEMA50 = ema20 > ema50
ema50AboveEMA200 = ema50 > ema200
// Buy condition
buyCondition = priceCrossAboveEMA20 and priceCloseAboveEMA20 and ema20AboveEMA50 and ema50AboveEMA200
// Plot buy signals
plotshape(series=buyCondition, location=location.belowbar, color=color.green, style=shape.labelup, text="BUY")
// Declare and initialize variables for take profit and stop loss levels
var float longTakeProfit = na
var float longStopLoss = na
var float buyPrice = na
// Update levels and variables on buy condition
if (buyCondition)
// Enter a new buy position
strategy.entry("Buy", strategy.long)
// Set new take profit and stop loss levels
longTakeProfit := strategy.position_avg_price * 1.10 // Target is 10% above the buy price
longStopLoss := strategy.position_avg_price * 0.95 // Stop loss is 5% below the buy price
buyPrice := strategy.position_avg_price
// Plot levels for the new trade
plotTakeProfit = plot(longTakeProfit, color=color.green, title="Take Profit", linewidth=1, offset=-1)
plotStopLoss = plot(longStopLoss, color=color.red, title="Stop Loss", linewidth=1, offset=-1)
plotBuyPrice = plot(buyPrice, color=color.blue, title="Buy Price", linewidth=1, offset=-1)
// Fill areas between buy price and take profit/stop loss levels
fill(plotBuyPrice, plotTakeProfit, color=color.new(color.green, 90), title="Fill to Take Profit") // Light green fill to target
fill(plotBuyPrice, plotStopLoss, color=color.new(color.red, 90), title="Fill to Stop Loss") // Light red fill to stop loss
// Exit conditions
strategy.exit("Take Profit/Stop Loss", from_entry="Buy", limit=longTakeProfit, stop=longStopLoss)