
1
Follow
1781
Followers
概要
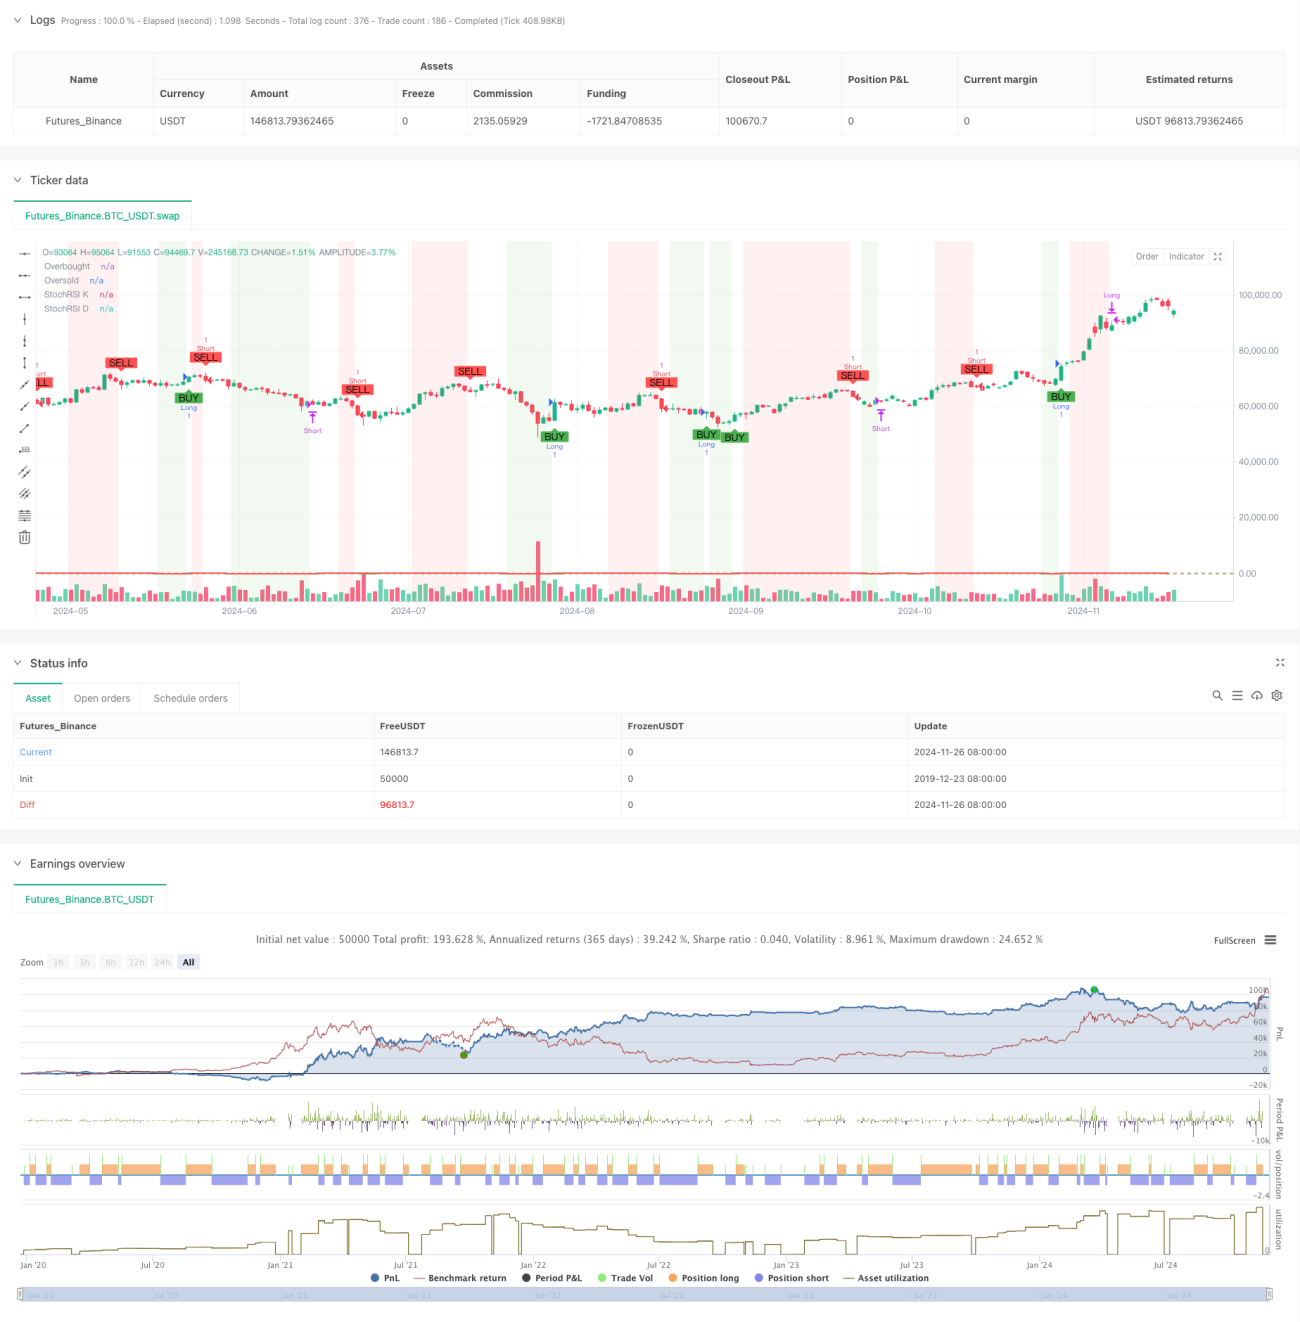
この戦略は,ランダムな比較的弱い指数 ((Stochastic RSI) と<unk>図形状を組み合わせた複合的な取引システムである.システムは,SRSI指標の超買超売りレベルを分析し,価格動向の<unk>図確認と組み合わせ,完全に自動化された取引シグナル生成を実現する.この戦略は,高度な技術指標の組み合わせを採用し,トレンド追跡と反転取引の特性を融合し,強力な市場適応性を有する.
戦略原則
戦略の中核となるロジックは、次の主要要素に基づいています。
- 14サイクルRSIをベースとして,RSI値をランダムに計算し,主要な信号源を形成します.
- ランダムなRSIのK線とD線を平滑シグナルとして3周期の単純移動平均に設定する
- 80と20を市場状態を判断するための過買過売の臨界値として設定する
- 市場動向の方向を確認するために,現在のグラフのオープニング価格とクロージング価格の関係と組み合わせる
- K線がオーバーセールレベルを向上して陽線が現れたとき,多信号をトリガーする
- K線が下向きに超買値線を横切って陰線が出たとき,空白信号を触発する
- K線が超買超売りレベルを横切るとき,対応方向のストップを実現する.
戦略的優位性
- 信号の信頼性: ランダムなRSIとグラフの二重確認メカニズムにより,取引信号の正確性が大幅に向上
- リスク管理が完ぺきです. 明確なストップ・ロスの条件が設定され,取引ごとにリスクを効果的に制御できます.
- パラメータの調整性:異なる市場特性に合わせて,重要なパラメータを最適化できます.
- 視覚的なフィードバックが明確:背景の色とグラフィックマークを使用して,取引信号を直感的に表示する
- 高度な自動化: 信号生成から注文実行までの全プロセスを自動化し,人間の介入を減らす
戦略リスク
- 横盤の振動で頻繁に偽のブレイクシグナルが生じる可能性
- 遅滞のリスク:移動平均の計算には遅滞があり,最適な入場点を逃す可能性があります.
- パラメータの感受性: パラメータの異なる設定は,戦略のパフォーマンスに著しく影響し,継続的な最適化が必要です.
- 市場環境依存: 波動的な市場環境では,信号が安定しない可能性があります.
- システムリスク:市場の重大事件が発生すると,ストップ・ロスの設定が失効する可能性がある
戦略最適化の方向性
- 取引量指標の導入: 取引量を信号確認の追加条件として増加させることができる
- ストップ・メカニズムを最適化: 追跡ストップまたはATRダイナミックストップを使用することを検討する
- トレンドフィルタを追加: 長期移動平均をトレンドフィルタとして追加
- シグナルフィルタリングの改善:市場の変動を考慮し,高変動時にパラメータを調整する
- ダイナミックパラメータ調整:市場の状況に応じてダイナミックに調整される超買い超売り<unk>値
要約する
この戦略は,ランダムなRSI指標と<unk>図形状を組み合わせて,安定した取引システムを構築する.システムは操作を簡素に保ちながら,優れたリスク管理を実現する.合理的なパラメータ最適化とシグナルフィルタリングにより,戦略は,異なる市場環境に適応する.トレーダーは,実況使用の前に,充分な歴史的データフィットバックを行い,特定の市場の特徴に応じてパラメータ設定を調整することをお勧めする.
Source
Pine
Strategy parameters
Related strategies
Comment
All comments (0)
No data
- 1