
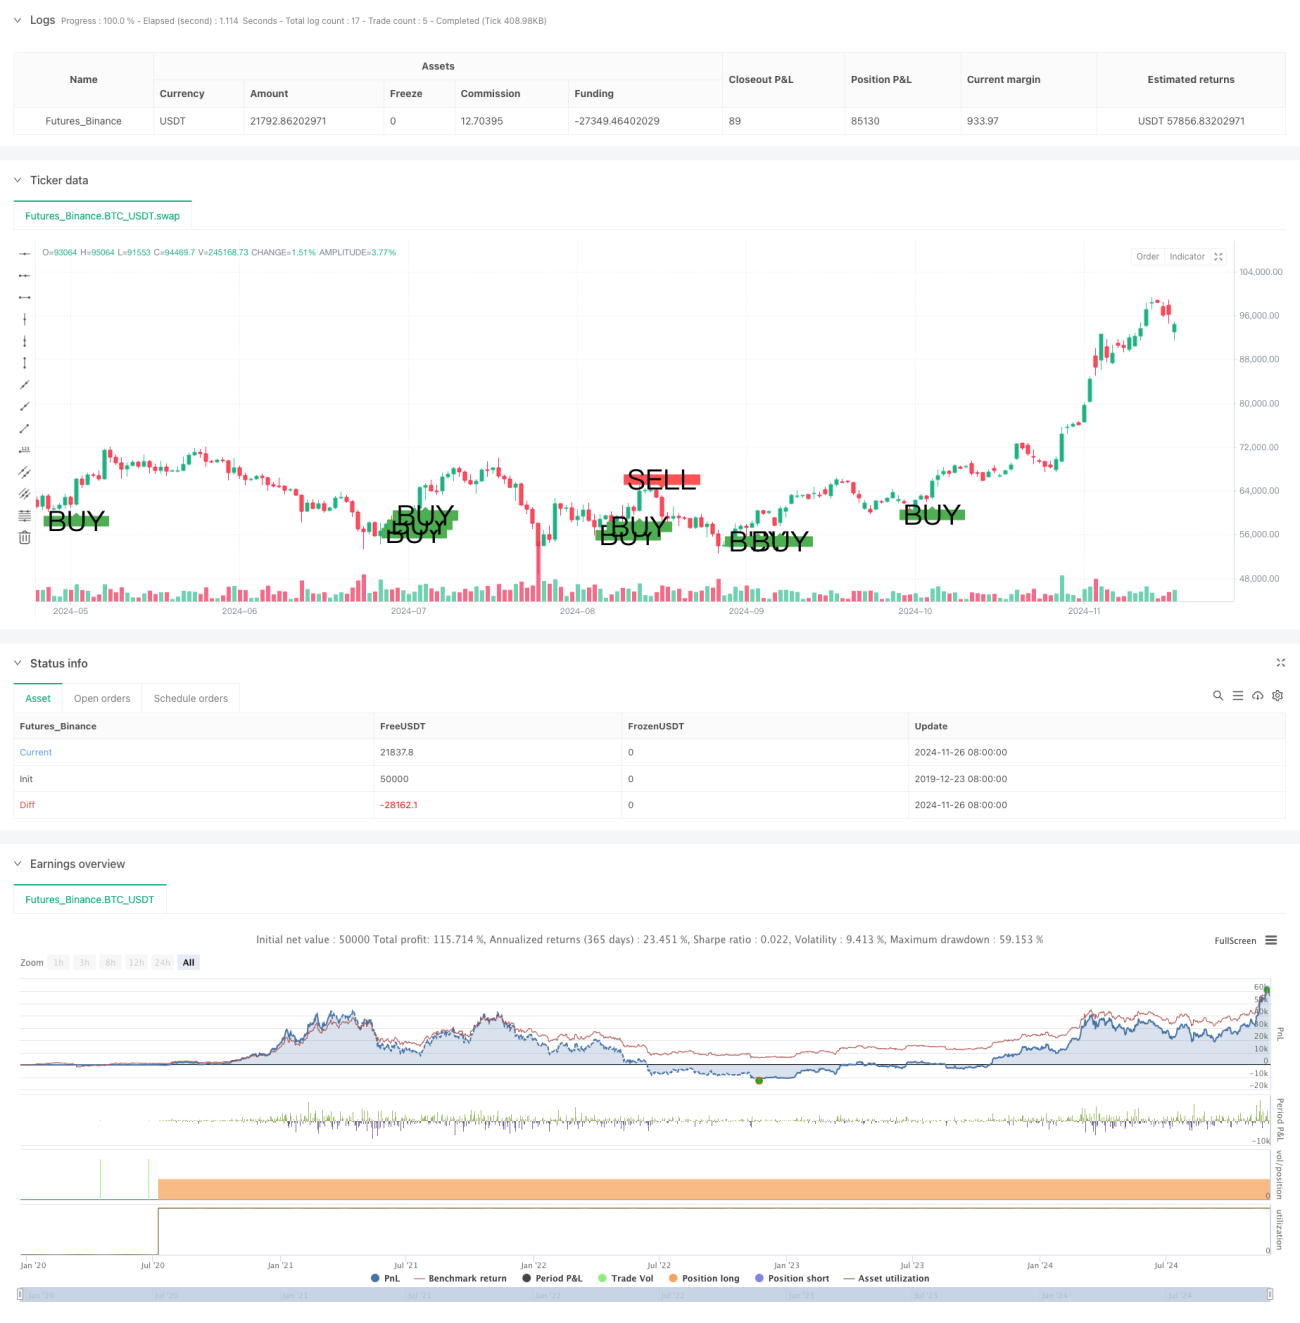
これは,複数の平均線,トレンド追跡,ストラクチャブレイク,およびモナティメーターを組み合わせた総合的な取引戦略である.この戦略は,複数の時間周期のトレンド方向を分析し,価格構造のブレイクとリコールバイプの組み合わせで取引シグナルを決定する.この戦略は,リスクを管理するために固定されたストップ・ロスと利益の目標を採用し,複数の検証メカニズムによって取引の正確性を向上させる.
戦略は,3つの指数移動平均 ((EMA25,EMA50,EMA200) を使って市場動向を決定する.価格がEMA200の上位にあり,EMA200は上方傾斜しているときは,上昇傾向にあると考えられるが,逆に下方動向と見なされる.トレンドの方向を決定した後,戦略は,価格がEMA25またはEMA50に逆戻りする機会を探します.同時に,戦略は,最近の高点または低点の突破を確認し,K線が価格の開封位置に相関して開封位置を確認し,証券の方向を検証する必要があります.
これは,合理的に設計された総合的な取引戦略であり,複数の技術指標の配合使用により,取引機会とリスクのコントロールを効果的にバランスします. この戦略の核心的な優点は,取引の成功率を高めるのに役立つ厳格な複数検証メカニズムにあります.
/*backtest
start: 2019-12-23 08:00:00
end: 2024-11-27 08:00:00
period: 1d
basePeriod: 1d
exchanges: [{"eid":"Futures_Binance","currency":"BTC_USDT"}]
*/
//@version=5
strategy("Custom Buy/Sell Strategy", overlay=true)
// Input parameters
ema25 = ta.ema(close, 25)
ema50 = ta.ema(close, 50)
ema200 = ta.ema(close, 200)
rsi = ta.rsi(close, 14)
sl_pips = 10
tp_pips = 15
// Convert pips to price units
sl_price_units = sl_pips * syminfo.pointvalue
tp_price_units = tp_pips * syminfo.pointvalue
// Define conditions for buy and sell signals
uptrend_condition = ema200 < close and ta.rising(ema200, 1)
downtrend_condition = ema200 > close and ta.falling(ema200, 1)
pullback_to_ema25 = low <= ema25
pullback_to_ema50 = low <= ema50
pullback_condition = pullback_to_ema25 or pullback_to_ema50
break_of_structure = high > ta.highest(high, 5)[1]
candle_imbalance = close > open
buy_condition = uptrend_condition and pullback_condition and rsi > 50 and break_of_structure and candle_imbalance
pullback_to_ema25_sell = high >= ema25
pullback_to_ema50_sell = high >= ema50
pullback_condition_sell = pullback_to_ema25_sell or pullback_to_ema50_sell
break_of_structure_sell = low < ta.lowest(low, 5)[1]
candle_imbalance_sell = close < open
sell_condition = downtrend_condition and pullback_condition_sell and rsi < 50 and break_of_structure_sell and candle_imbalance_sell
// Plot signals on the chart
plotshape(series=buy_condition, location=location.belowbar, color=color.green, style=shape.labelup, text="BUY", size=size.large)
plotshape(series=sell_condition, location=location.abovebar, color=color.red, style=shape.labeldown, text="SELL", size=size.large)
// Calculate stop loss and take profit levels for buy signals
var float buy_sl = na
var float buy_tp = na
if buy_condition and strategy.position_size == 0
buy_sl := close - sl_price_units
buy_tp := close + tp_price_units
strategy.entry("Buy", strategy.long)
strategy.exit("TP/SL Buy", from_entry="Buy", limit=buy_tp, stop=buy_sl)
label.new(bar_index, high, text="Entry: " + str.tostring(close) + "\nSL: " + str.tostring(buy_sl) + "\nTP: " + str.tostring(buy_tp), style=label.style_label_up, color=color.green, textcolor=color.white, size=size.small)
// Calculate stop loss and take profit levels for sell signals
var float sell_sl = na
var float sell_tp = na
if sell_condition and strategy.position_size == 0
sell_sl := close + sl_price_units
sell_tp := close - tp_price_units
strategy.entry("Sell", strategy.short)
strategy.exit("TP/SL Sell", from_entry="Sell", limit=sell_tp, stop=sell_sl)
label.new(bar_index, low, text="Entry: " + str.tostring(close) + "\nSL: " + str.tostring(sell_sl) + "\nTP: " + str.tostring(sell_tp), style=label.style_label_down, color=color.red, textcolor=color.white, size=size.small)
// // Plot stop loss and take profit levels for buy signals
// if not na(buy_sl)
// line.new(x1=bar_index, y1=buy_sl, x2=bar_index + 1, y2=buy_sl, color=color.red, width=1)
// if not na(buy_tp)
// line.new(x1=bar_index, y1=buy_tp, x2=bar_index + 1, y2=buy_tp, color=color.green, width=1)
// // Plot stop loss and take profit levels for sell signals
// if not na(sell_sl)
// line.new(x1=bar_index, y1=sell_sl, x2=bar_index + 1, y2=sell_sl, color=color.red, width=1)
// if not na(sell_tp)
// line.new(x1=bar_index, y1=sell_tp, x2=bar_index + 1, y2=sell_tp, color=color.green, width=1)