
1
Follow
1781
Followers
概要
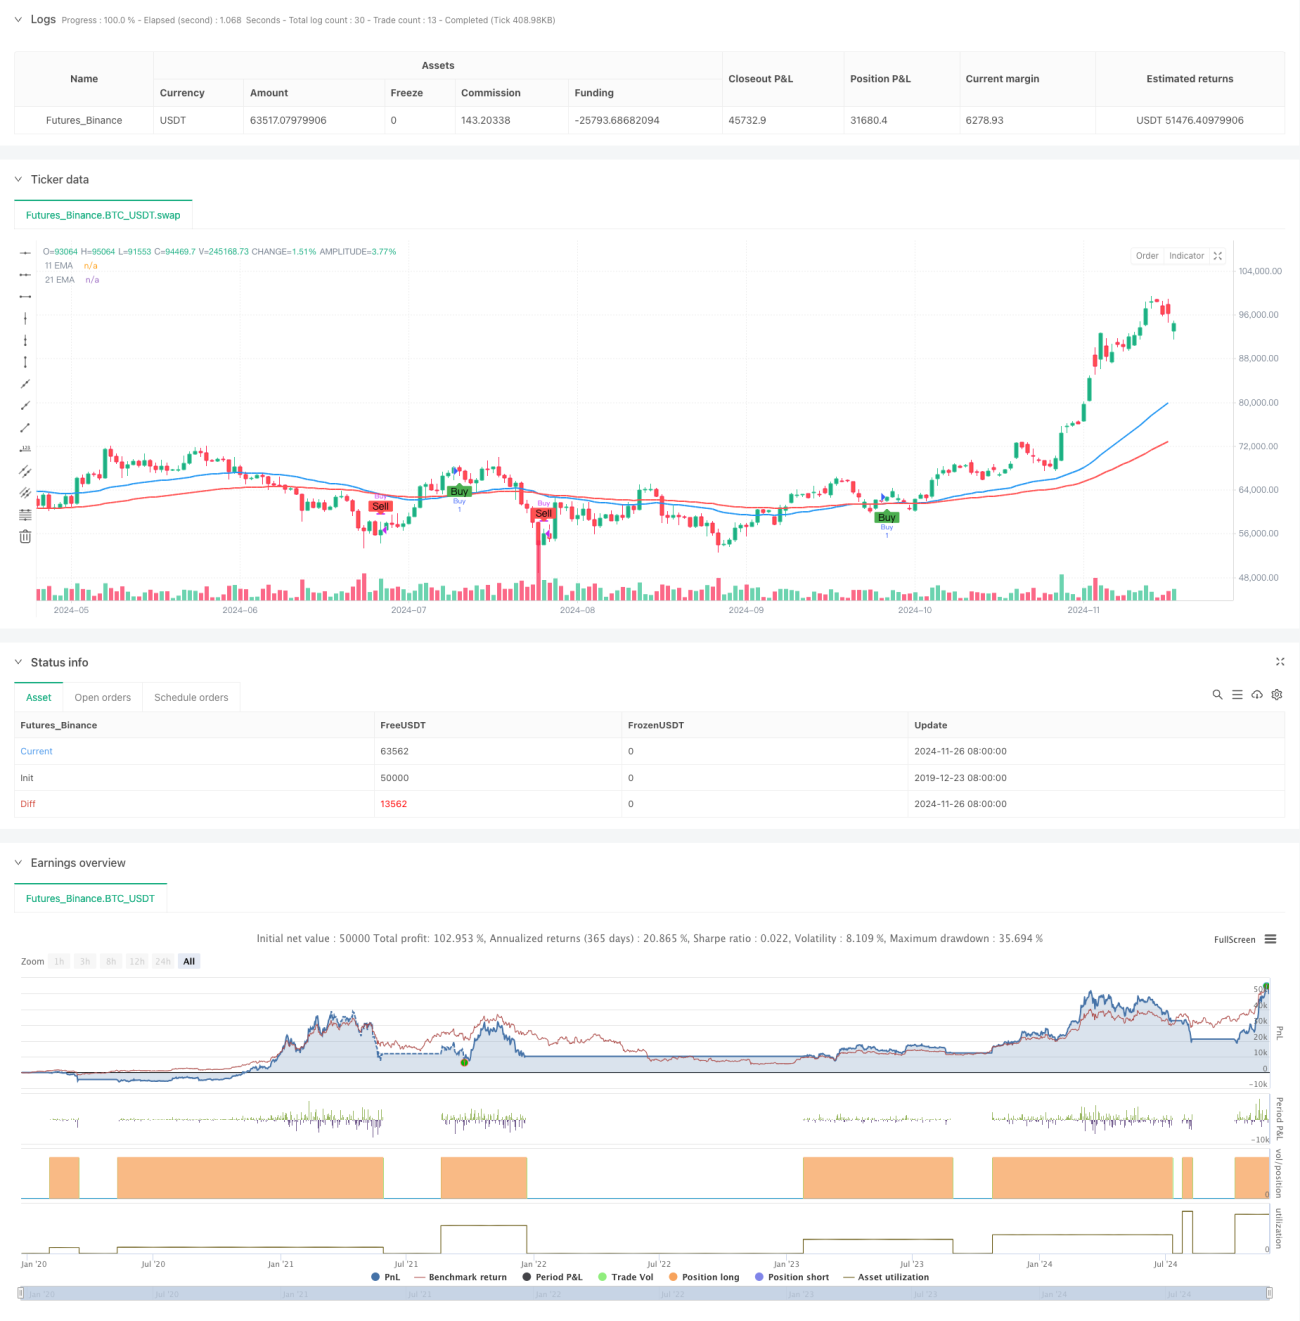
これは,双均線交差とトレンド追跡に基づく定量取引戦略である.この戦略は,主に47サイクルと95周期の指数移動平均 ((EMA)) を使って,均線交差シグナルによって取引を行う.この戦略は15分間の時間周期で動作し,技術分析と動量取引のコア心理を統合し,安定した取引収益を達成することを目的としています.
戦略原則
戦略の核心は,短期EMA ((47サイクル) と長期EMA ((95サイクル) の交差を利用してトレンドの変化を識別することである.短期EMAが上方から長期EMAを横切るとき,システムは多信号を生成し,短期EMAが下方から長期EMAを横切るとき,システムは平仓する.この設計は,価格動力とトレンド継続性の原理に基づいて,均線交差によってトレンド転換点を確認し,市場の主な動きを把握する.
戦略的優位性
- 信号明晰:双均線交差は,明確な入場と出場信号を提供し,主観的な判断による不確実性を軽減する.
- トレンド追跡:戦略は,中短期のトレンドを効果的に捉え,トレンドが続く間,利益を得る.
- 自動化度が高い: 戦略の論理はシンプルで明快で,プログラム的に実装し,反テストで検証しやすい.
- 適応性:平均周期を調整することで,戦略は異なる市場環境と取引品種に適応できます.
- リスク管理: 交易規則を体系化することで,感情の変動を制御し,取引の規律を維持できます.
戦略リスク
- 振動市場には適用されない:横盤振動市場では,頻繁に偽突破が連続的な損失を引き起こす可能性がある.
- 遅滞性:平均線指標は遅滞性があり,最良の入場タイミングを逃すか,トレンド転換時に大きな後退が発生する可能性があります.
- パラメータ依存:平均線周期の選択は戦略のパフォーマンスに大きな影響を与える.異なる市場では異なるパラメータ設定が必要である.
- 資金管理: 完ぺきなストップ・ロースの欠如により,急激な変動で大きな損失を被る可能性があります.
戦略最適化の方向性
- 波動率指標の導入:ATR指標を追加して,ストップローズを動的に調整し,リスク管理能力を向上させる.
- トレンドフィルターを増やす:RSIやMACDなどの指標を組み合わせて,より信頼性の高い取引シグナルをフィルターする.
- 最適化パラメータ選択: 機械学習方法を使用して,異なる市場環境のために最適な平均線周期を自動的に選択できます.
- 資金管理の改善:ポジション管理とリスク管理モジュールを追加し,取引毎の最大損失割合を設定する.
- 市場環境判断を追加: 市場の構造分析を導入し,波動的な市場で取引頻度を低下させ,または取引を一時停止する.
要約する
これは,構造が明確で,論理が厳格なトレンド追跡戦略である.双均線交差によって市場トレンドを捕捉し,操作性と拡張性が優れている.一定の限界があるが,継続的な最適化と完善によって,安定した信頼性の高い取引システムに発展する見込みがある.異なる市場特性に合わせてパラメータを柔軟に調整し,完善したリスク制御機構を構築することに重点を置いている.
Source
Pine
Related strategies
Comment
All comments (0)
No data
- 1