複数の移動平均クロスオーバーとRSIダイナミックトレーリングストップロス定量取引戦略

MA RSI SMA SL TS
作成日: 2024-11-29 16:10:35 最終変更日: 2024-11-29 16:10:35
コピー: 1 クリック数: 461
1
フォロー
1617
フォロワー

複数の移動平均クロスオーバーとRSIダイナミックトレーリングストップロス定量取引戦略

概要

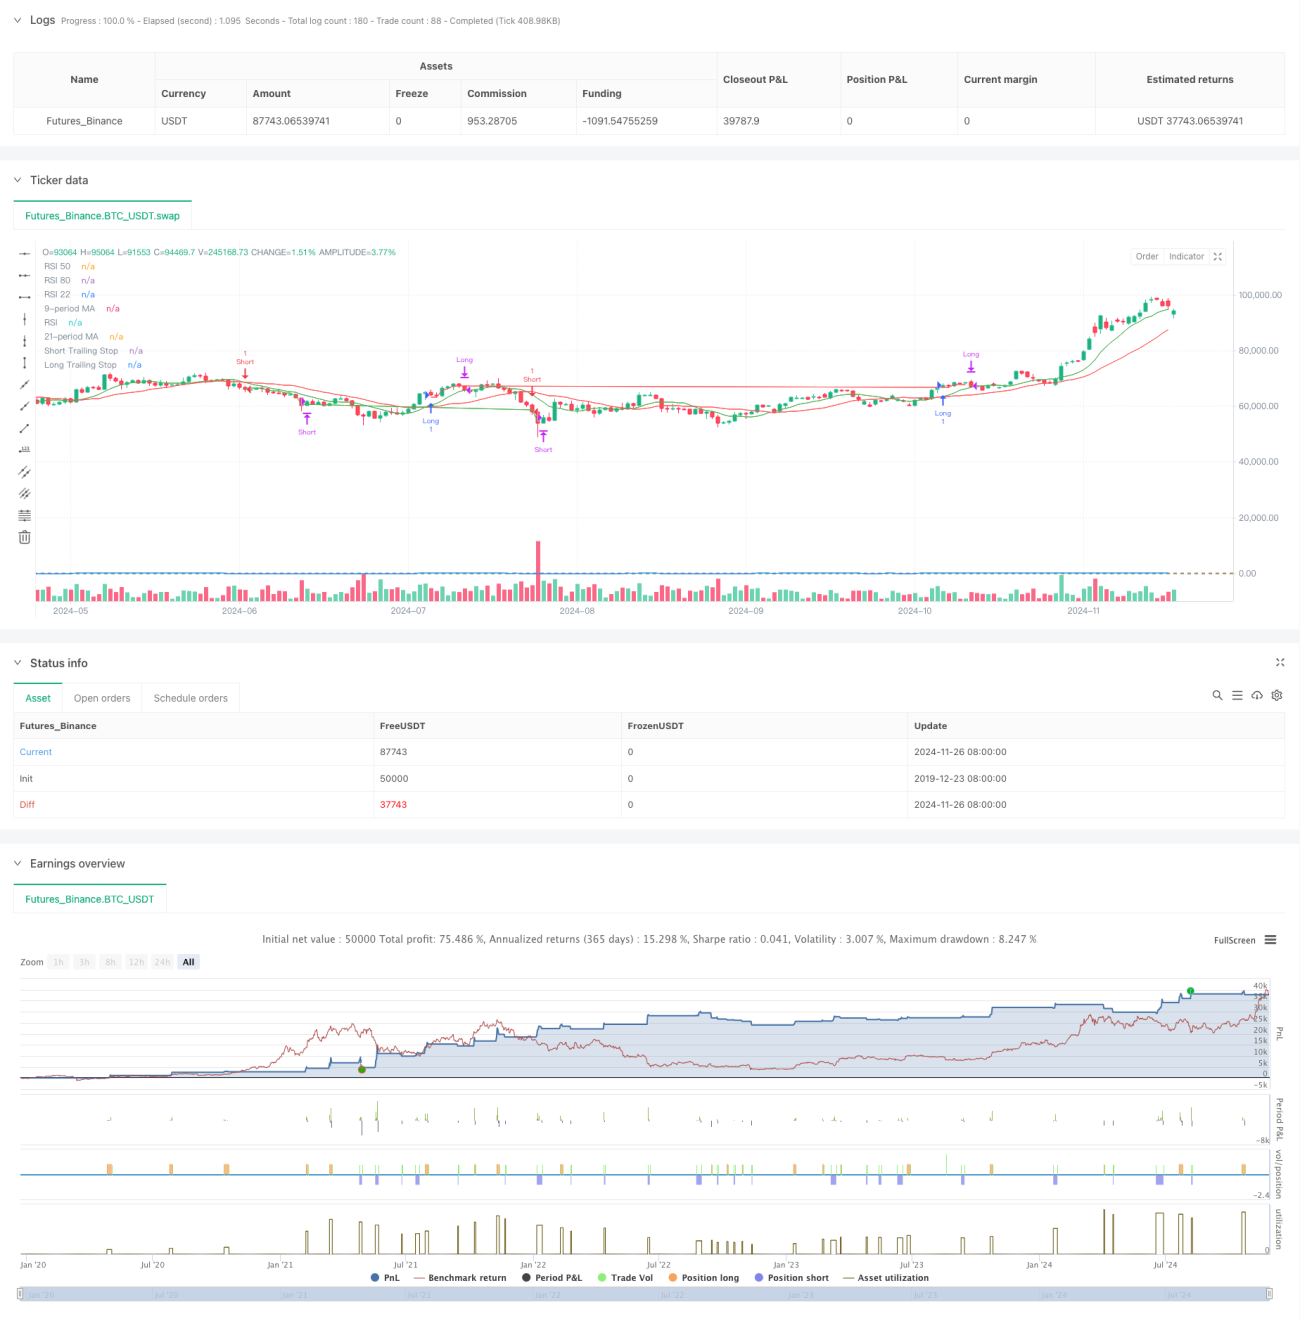
この戦略は,移動平均クロスと比較的強い指数 ((RSI)) を組み合わせた定量取引システムであり,同時にストップ追跡機能を統合しています. この戦略は,9周期と21周期の2つの移動平均を主要なトレンド判断指標として使用し,RSI指標と組み合わせて取引信号の確認を行い,ダイナミックなストップ追跡によって利益とリスクの保護と制御を行います. 戦略設計は,市場傾向,動量とリスク管理の3つの次元を十分に考慮して,完全な取引システムを形成しています.

戦略原則

戦略の中核となるロジックは、次の主要な要素に基づいています。

  1. トレンド識別: 急速 (サイクル) と遅い (<21サイクル) の移動平均の交差によって市場のトレンドの変化を識別する. 速線でゆっくりとRSIが55より大きいとき,多信号を生成する. 速線の下でゆっくりとRSIが45より小さいとき,空白信号を生成する.
  2. 信号確認:RSIを信号フィルターとして使用し,RSIの値を設定することで取引信号の信頼性を向上させる.
  3. リスクコントロール:1%の追跡ストップを採用し,利潤を保護するためにストップポジションを動的に調整する.同時に,RSIに基づく利潤を得た終了条件を設定し,RSIが80以上または22未満の時に,それぞれ,平仓多頭および空頭ポジションを設定する.
  4. ストップ・メカニズム: 固定ストップと追跡ストップを組み合わせて,価格がエントリーポイントの設定されたパーセントを突破したり,追跡ストップラインに触れたときに自動的にポジションをクリアする.

戦略的優位性

  1. 多次元信号検証:均線交差とRSIの二重確認により,取引信号の正確性を向上させる.
  2. 優れたリスク管理: ダイナミック・トラッキング・ストップ・ロスを採用し,収益を保護し,リスクを制御する.
  3. フレキシブルなエントリーメカニズム:トレンドと動力の指標を組み合わせて,市場の転換点を効果的に捉える.
  4. 自動化レベルが高い: 戦略の論理が明確で,自動化取引を容易に実現する.
  5. 適応性:パラメータを調整することで異なる市場環境に適応できます.

戦略リスク

  1. 振動市場リスク:横盤振動市場では,頻繁に偽の突破信号が生じることがあります.
  2. スライドポイントリスク: ストップ・ロスを追跡する過程でスライドポイントの損失に直面する可能性があります.
  3. 参数感性: 平均線周期とRSI値の設定は,戦略のパフォーマンスに大きな影響を与える.
  4. システムリスク: 極端な状況では,一時停止が実行されない可能性があります.

戦略最適化の方向性

  1. 信号最適化:信号確認の補足条件として交付量指標を導入することができる.
  2. ストップ・損失最適化:変動率に基づく動的ストップ・損失比率調整機構を考慮する.
  3. ポジション管理:リスク評価に基づくダイナミックなポジション管理システムを追加.
  4. 市場適応性:市場環境の識別機構を追加し,異なる市場状態で異なるパラメータ設定を使用する.
  5. シグナルフィルター: 市場開盤と閉盤前の波動期間の取引を避けるために時間フィルターを追加できます.

要約する

この戦略は,技術分析のクラシックな指標を組み合わせて,トレンド追跡と動力の特徴を兼ね備えた取引システムを構築している.その核心的な優点は,多次元的な信号確認機構と完善したリスク管理システムにある.継続的な最適化と改善により,この戦略は,異なる市場環境で安定したパフォーマンスを維持する見込みがある.トレーダーに,実体での使用の前に,十分な反測検証を行い,取引品種の特定の特性に応じてパラメータ設定を調整することを推奨している.

ストラテジーソースコード
/*backtest
start: 2019-12-23 08:00:00
end: 2024-11-27 08:00:00
period: 1d
basePeriod: 1d
exchanges: [{"eid":"Futures_Binance","currency":"BTC_USDT"}]
*/

//@version=5
strategy("ojha's Intraday MA Crossover + RSI Strategy with Trailing Stop", overlay=true)

// Define Moving Averages
fastLength = 9
slowLength = 21
fastMA = ta.sma(close, fastLength)
slowMA = ta.sma(close, slowLength)

// Define RSI
rsiPeriod = 14
rsiValue = ta.rsi(close, rsiPeriod)

// Define Conditions for Long and Short
longCondition = ta.crossover(fastMA, slowMA) and rsiValue > 55
shortCondition = ta.crossunder(fastMA, slowMA) and rsiValue < 45

// Define the trailing stop distance (e.g., 1% trailing stop)
trailingStopPercent = 1.0

// Variables to store the entry candle high and low
var float longEntryLow = na
var float shortEntryHigh = na

// Variables for trailing stop levels
var float longTrailingStop = na
var float shortTrailingStop = na

// Exit conditions
exitLongCondition = rsiValue > 80
exitShortCondition = rsiValue < 22

// Stop-loss conditions (price drops below long entry candle low * 1% or exceeds short entry candle high * 1%)
longStopLoss = longEntryLow > 0 and close < longEntryLow * 0.99
shortStopLoss = shortEntryHigh > 0 and close > shortEntryHigh * 1.01

// Execute Buy Order and store the entry candle low for long stop-loss
if (longCondition)
    strategy.entry("Long", strategy.long)
    longEntryLow := low  // Store the low of the candle where long entry happened
    longTrailingStop := close * (1 - trailingStopPercent / 100)  // Initialize trailing stop at entry

// Execute Sell Order and store the entry candle high for short stop-loss
if (shortCondition)
    strategy.entry("Short", strategy.short)
    shortEntryHigh := high  // Store the high of the candle where short entry happened
    shortTrailingStop := close * (1 + trailingStopPercent / 100)  // Initialize trailing stop at entry

// Update trailing stop for long position
if (strategy.opentrades > 0 and strategy.position_size > 0)
    longTrailingStop := math.max(longTrailingStop, close * (1 - trailingStopPercent / 100))  // Update trailing stop as price moves up

// Update trailing stop for short position
if (strategy.opentrades > 0 and strategy.position_size < 0)
    shortTrailingStop := math.min(shortTrailingStop, close * (1 + trailingStopPercent / 100))  // Update trailing stop as price moves down

// Exit Buy Position when RSI is above 80, Stop-Loss triggers, or trailing stop is hit
if (exitLongCondition or longStopLoss or close < longTrailingStop)
    strategy.close("Long")
    longEntryLow := na  // Reset the entry low after the long position is closed
    longTrailingStop := na  // Reset the trailing stop

// Exit Sell Position when RSI is below 22, Stop-Loss triggers, or trailing stop is hit
if (exitShortCondition or shortStopLoss or close > shortTrailingStop)
    strategy.close("Short")
    shortEntryHigh := na  // Reset the entry high after the short position is closed
    shortTrailingStop := na  // Reset the trailing stop

// Plot Moving Averages on the Chart
plot(fastMA, color=color.green, title="9-period MA")
plot(slowMA, color=color.red, title="21-period MA")

// Plot RSI on a separate panel
rsiPlot = plot(rsiValue, color=color.blue, title="RSI")
hline(50, "RSI 50", color=color.gray)
hline(80, "RSI 80", color=color.red)
hline(22, "RSI 22", color=color.green)

// Plot Trailing Stop for Visualization
plot(longTrailingStop, title="Long Trailing Stop", color=color.red, linewidth=1, style=plot.style_line)
plot(shortTrailingStop, title="Short Trailing Stop", color=color.green, linewidth=1, style=plot.style_line)