
1
Follow
1780
Followers
概要
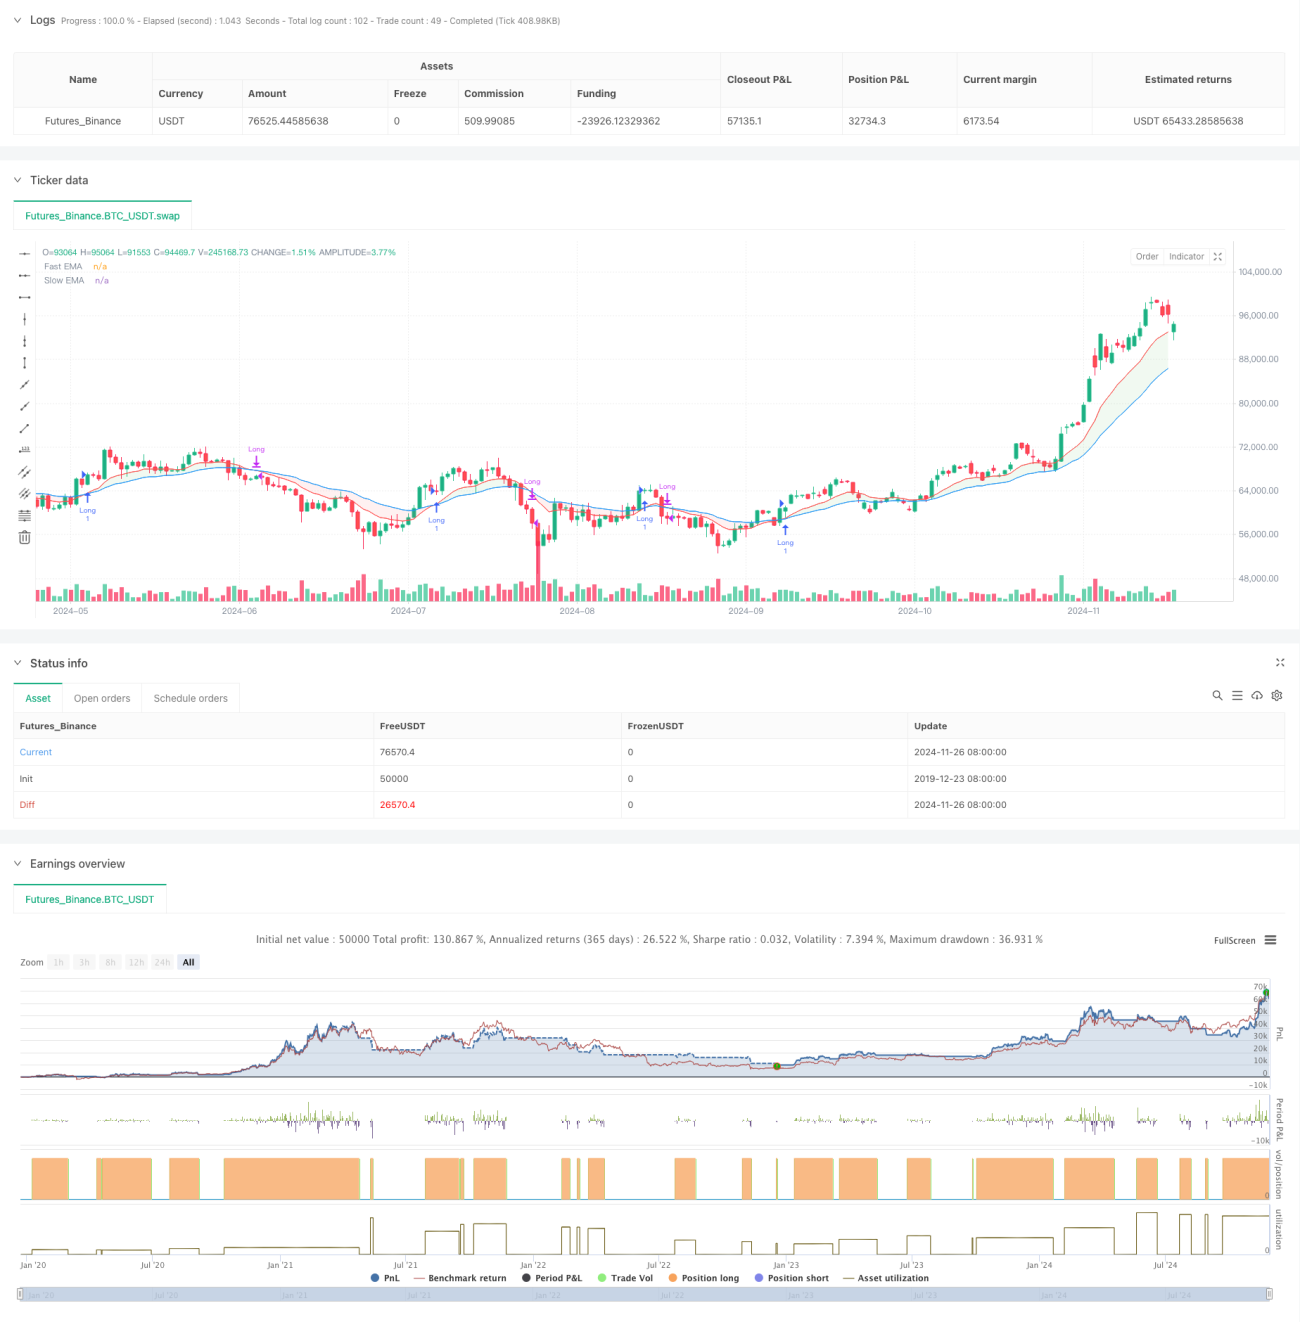
この戦略は,双均線 (快速EMAと遅速EMA) をベースにした動的区域トレンド追跡システムである.価格と双均線との位置関係によって異なる取引領域を区分し,動的色指示システムと組み合わせて,トレーダーに明確な買入シグナルを提供している.この戦略は,古典的な均線交差理論を採用し,地域区分の革新的な方法によって,従来の双均線システムの操作性を向上させている.
戦略原則
戦略の核心は,高速EMA ((デフォルト12サイクル) と遅いEMA ((デフォルト26サイクル) の交差関係によって,価格位置と組み合わせて,市場状態を6つの異なる領域に分割することである. 速線がスローラインの上にあるときは,市場は多頭トレンドであると考えられ,反対に空頭トレンドと見なされる.この2つの均線に対する価格の位置は,特定の取引領域をさらに細分化します. 緑の領域 ((買入),青の領域 ((潜在的買入),赤の領域 ((販売)) と黄色の領域 ((潜在的出入).
戦略的優位性
- 視覚的直感性:色域の動的変化によって,トレーダーは市場状態と潜在的な取引機会を直感的に判断することができます.
- トレンド確認: 双均線システムは,偽信号を減らすための信頼できるトレンド確認機構を提供します.
- リスク管理: 明確な地域区分は,ストップ・ストップ・ストラトジーを策定するのに役立ちます.
- 適応性: 戦略は様々な時間周期に適用され,様々な市場環境に適しています.
- パラメータは調整可能:平均線周期と滑りパラメータは,異なる市場特性に応じて最適化できます.
戦略リスク
- 遅滞性:均線指標は本質的に遅滞性があり,出場や出場のタイミングが遅れる可能性がある.
- 振動市場には適用されない:横盤振動市場では頻繁に偽信号が生じることがあります.
- トレンドの逆転リスク:突然のトレンドの逆転に,戦略的反応が迅速にできないかもしれない.
- パラメータ依存:異なる市場環境において最適なパラメータには著しい差異がある可能性がある.
戦略最適化の方向性
- 波動率フィルターの導入:高波動率の環境で取引条件を調整し,偽信号を避ける.
- 交差量確認:交差量指標を組み合わせて信号の信頼性を向上させる.
- 動的パラメータ調整:市場状況に応じて平均線周期を自動的に調整する.
- トレンド強度指標を追加: ADXなどの指標を導入してトレンド強さを評価する.
- オプティマイズ・ストップ・ストラテジー:ATRに基づく動的ストップ・プランの設計.
要約する
これは,伝統的な二均線システムと近代的な区分理念を組み合わせたトレンド追跡戦略である. 直観的な視覚的フィードバックと明確な取引ルールによって,トレーダーに信頼性の高い取引の枠組みを提供している. 均線システムに固有の遅滞の問題があるにもかかわらず,合理的なパラメータ最適化とリスク管理によって,この戦略は,トレンド市場の安定したパフォーマンスを得ることができる.
Source
Pine
/*backtest
start: 2019-12-23 08:00:00
end: 2024-11-27 08:00:00
period: 1d
basePeriod: 1d
exchanges: [{"eid":"Futures_Binance","currency":"BTC_USDT"}]
*/

//@version=5
strategy("NUTJP CDC ActionZone 2024", overlay=true, precision=6, commission_value=0.1, slippage=3)

//****************************************************************************//Strategy parameters
Related strategies
Comment
All comments (0)
No data
- 1