ダイナミックATRストップロスを備えたRSI売られすぎ弾性定量戦略

RSI SMA ATR TP SL
作成日: 2024-11-29 16:18:55 最終変更日: 2024-11-29 16:18:55
コピー: 0 クリック数: 453
1
フォロー
1617
フォロワー

ダイナミックATRストップロスを備えたRSI売られすぎ弾性定量戦略

概要

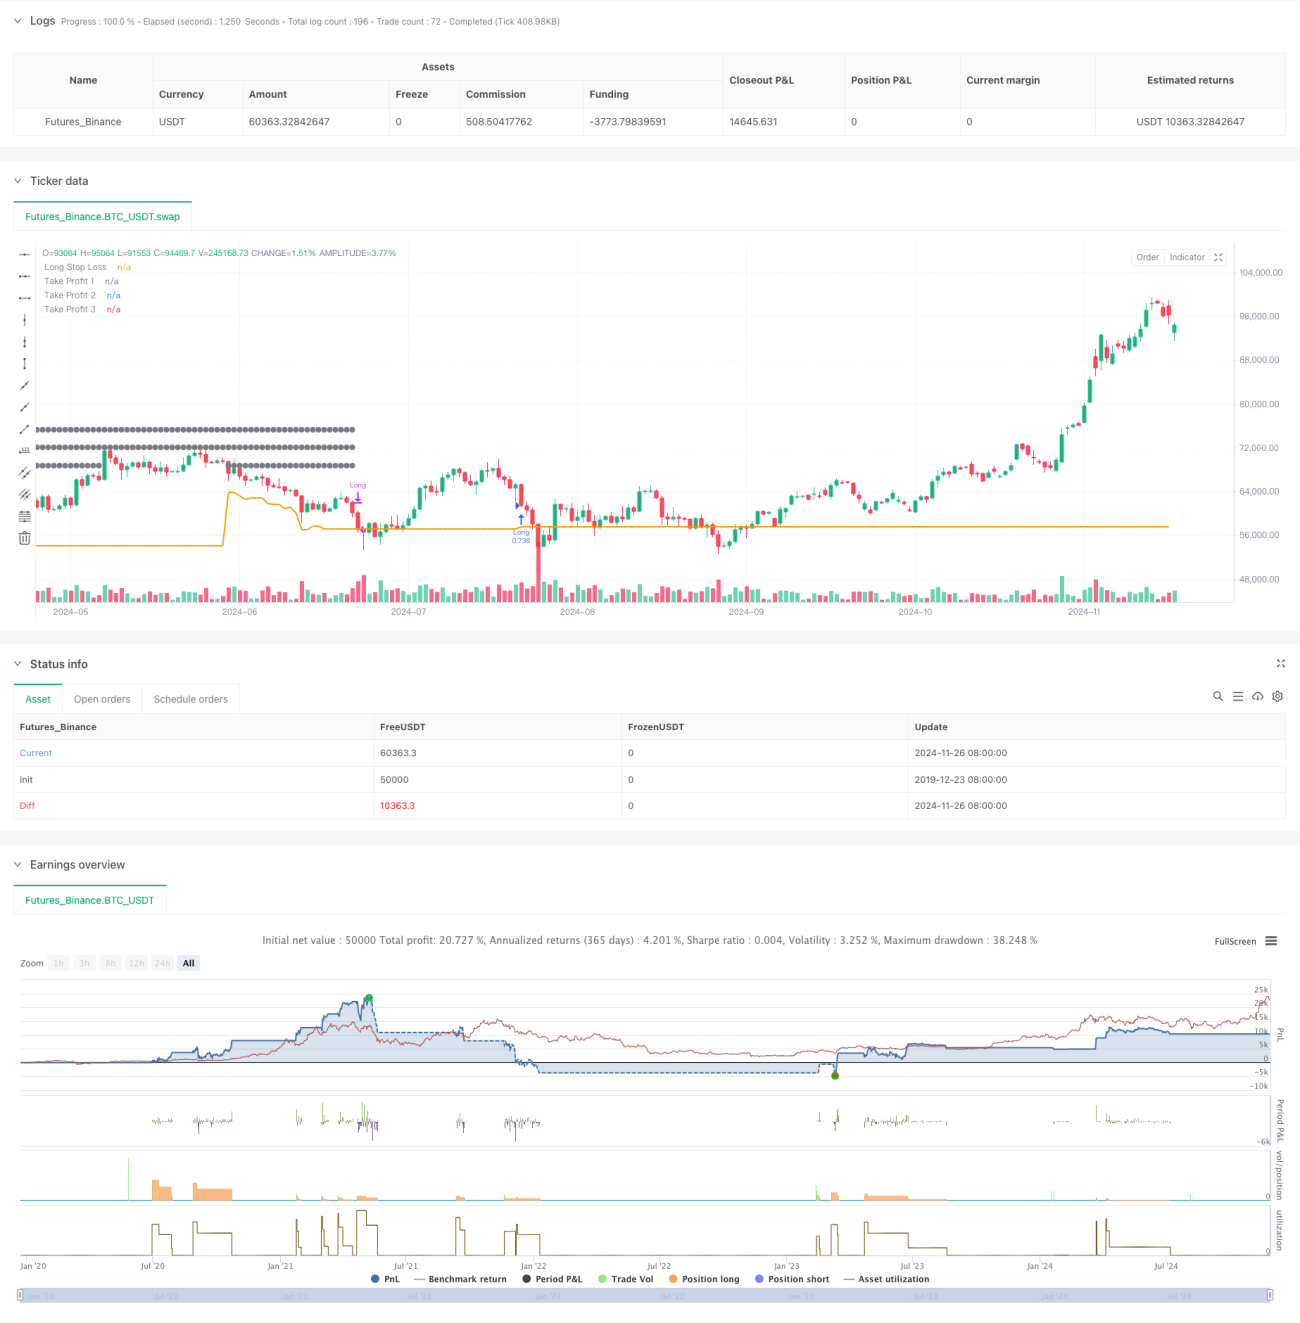
この戦略は,RSIオーバーセールシグナルと動的なATRストップをベースにした量化取引システムである.この戦略は,RSI指標のオーバーセールシグナルと200日平均線を組み合わせた日線レベルのデータを使用し,市場のオーバーセール時に反発の機会をキャプチャする.この戦略は,動的なATRストップと静的なパーセンテージストップの二重保護機構を採用し,分期減仓によって利益を最大化するために三重利益目標を設定している.

戦略原則

戦略の中核となるロジックには、次の重要な要素が含まれます。

  1. 入場シグナル: RSI ((5) が30の超売りレベルを下回り,価格が200日平均線上にあるとき,システムは多信号を発する.
  2. ストップ・メカニズム:1.5倍ATR ((20) の動的ストップと25%の固定ストップを組み合わせた二重メカニズム.
  3. 利益目標:5%,10%および15%の3つの目標位を設定し,目標に達した時点でそれぞれ33%,66%および100%の減仓を設定した.
  4. ポジション管理:ケリー指針で計算された59.13%のポジションを使用するか,保守的に75%のポジションを使用して取引することをお勧めします.

戦略的優位性

  1. ダブルトレンド確認:RSIオーバーセールと平均線トレンドのダブル検証により,取引勝利率を向上させる.
  2. 柔軟なリスク管理: 動的ATRストップは,市場の波動に応じて自律的に調整され,固定ストップは最後の防衛線を提供します.
  3. スマート利益管理: 三重目標位は,分段の減仓と連携して,利益の一部をロックし,大市場を見逃さないようにする.
  4. 資金管理科学:リスクと利益のバランスを取るために,ケリー指針を用いてポジションを最適化する.

戦略リスク

  1. トレンド依存性: 戦略は波動的な市場では頻繁にストップを誘発する可能性がある. 推薦: 振動指数に偽信号をフィルターする機能を追加してください.

  2. 止損幅が大きい:25%の固定止損は,単一の損失が過大になる可能性がある. 推奨:個人リスク承受能力に応じて,止損率を調整する.

  3. 利回りリスク: 利回りリスクは,強気な状況下では,利回り率を早めに下げる可能性があります. 推奨: 収益目標の動的調整,またはトレンド追跡部分のポジションの保持.

戦略最適化の方向性

  1. 信号の最適化:
  • 添付量確認
  • MACDのようなトレンド指標と組み合わせて
  • ボラティリティフィルターの導入
  1. ストップ・ローズ・オプティマイゼーション
  • ダイナミック・ストップ・レッテルを実現
  • 時間の停止を増加させる
  • 収益比率をフィルターする
  1. 収益の最適化:
  • ATRベースの動的なターゲット設定
  • 追跡停止を実現する
  • ポジション減額率の最適化

要約する

この戦略は,RSI超売りシグナルと均線トレンドフィルタを組み合わせ,動的ATRストップとトリプルリターンの目標と連携して,完全な取引システムを構築している.戦略の優点は,リスク管理が柔軟で,リターンの管理は合理的であることにあるが,実際の市場状況と個人のリスク好みに合わせて最適化調整が依然として必要である.信号システム,ストップメカニズム,リターンの戦略を継続的に改善することにより,このシステムは,実際の取引盤でより良いパフォーマンスを期待している.

ストラテジーソースコード
/*backtest
start: 2019-12-23 08:00:00
end: 2024-11-27 08:00:00
period: 1d
basePeriod: 1d
exchanges: [{"eid":"Futures_Binance","currency":"BTC_USDT"}]
*/

// This work is licensed under a Attribution-NonCommercial-ShareAlike 4.0 International (CC BY-NC-SA/4.0) https://creativecommons.org/licenses/by-nc-sa/4.0/
// © wielkieef

//@version=5
strategy("Simple RSI stock Strategy [1D] ", overlay=true, pyramiding=1, initial_capital=10000, default_qty_type=strategy.percent_of_equity, default_qty_value=75, calc_on_order_fills=false, slippage=0, commission_type=strategy.commission.percent, commission_value=0.03)

// Rsi
oversoldLevel = input(30, title="Oversold Level")
overboughtLevel = input(70, title="Overbought Level")
rsi = ta.rsi(close, 5)
rsi_overbought = rsi > overboughtLevel  
rsi_oversold = rsi < oversoldLevel

// Sma 200
lenghtSMA = input(200, title = "SMA lenght")
sma200 = ta.sma(close, lenghtSMA)

// ATR stop-loss
atrLength = input.int(20, title="ATR Length")
atrMultiplier = input.float(1.5, title="ATR Multiplier")
atrValue = ta.atr(atrLength)
var float long_stop_level = na
var float short_stop_level = na
var float tp1_level = na
var float tp2_level = na
var float tp3_level = na

// Strategy entry
long = (rsi_oversold ) and close > sma200 

// Take Profit levels
tp_1 = input.float(5.0, "TP 1", minval=0.1, step=0.1)
tp_2 = input.float(10.0, "TP 2", minval=0.2, step=0.1)
tp_3 = input.float(15.0, "TP 3", minval=0.3, step=0.1)

if long
    strategy.entry('Long', strategy.long)
    long_stop_level := close - atrMultiplier * atrValue
    tp1_level := strategy.position_avg_price * (1 + tp_1 / 100)
    tp2_level := strategy.position_avg_price * (1 + tp_2 / 100)
    tp3_level := strategy.position_avg_price * (1 + tp_3 / 100)

// basic SL - this code is from author RafaelZioni, modified by wielkieef
sl = input.float(25.0, 'Basic Stop Loss %', step=0.1)
per(procent) =>
    strategy.position_size != 0 ? math.round(procent / 100 * strategy.position_avg_price / syminfo.mintick) : float(na)

// ATR SL
if (strategy.position_size > 0 and (close <= long_stop_level))
    strategy.close("Long")
    tp1_level := na
    tp2_level := na
    tp3_level := na
plot(long_stop_level, color=color.orange, linewidth=2, title="Long Stop Loss")

// TP levels
if (strategy.position_size > 0)
    if (not na(tp1_level) and close >= tp1_level)
        tp1_level := na
    if (not na(tp2_level) and close >= tp2_level)
        tp2_level := na
    if (not na(tp3_level) and close >= tp3_level)
        tp3_level := na

plot(strategy.position_size > 0 and not na(tp1_level) ? tp1_level : na, color=color.gray, style=plot.style_circles , linewidth=1, title="Take Profit 1")
plot(strategy.position_size > 0 and not na(tp2_level) ? tp2_level : na, color=color.gray, style=plot.style_circles , linewidth=1, title="Take Profit 2")
plot(strategy.position_size > 0 and not na(tp3_level) ? tp3_level : na, color=color.gray, style=plot.style_circles , linewidth=1, title="Take Profit 3")

// Strategy exit points for Take Profits
strategy.exit('TP 1', from_entry="Long", qty_percent=33, profit=per(tp_1), loss=per(sl))
strategy.exit('TP 2', from_entry="Long", qty_percent=66, profit=per(tp_2), loss=per(sl))
strategy.exit('TP 3', from_entry="Long", qty_percent=100, profit=per(tp_3), loss=per(sl))

// by wielkieef