動的リスク管理と固定利益に基づく高度な公正価値ギャップ検出戦略

1
Follow
1781
Followers
概要
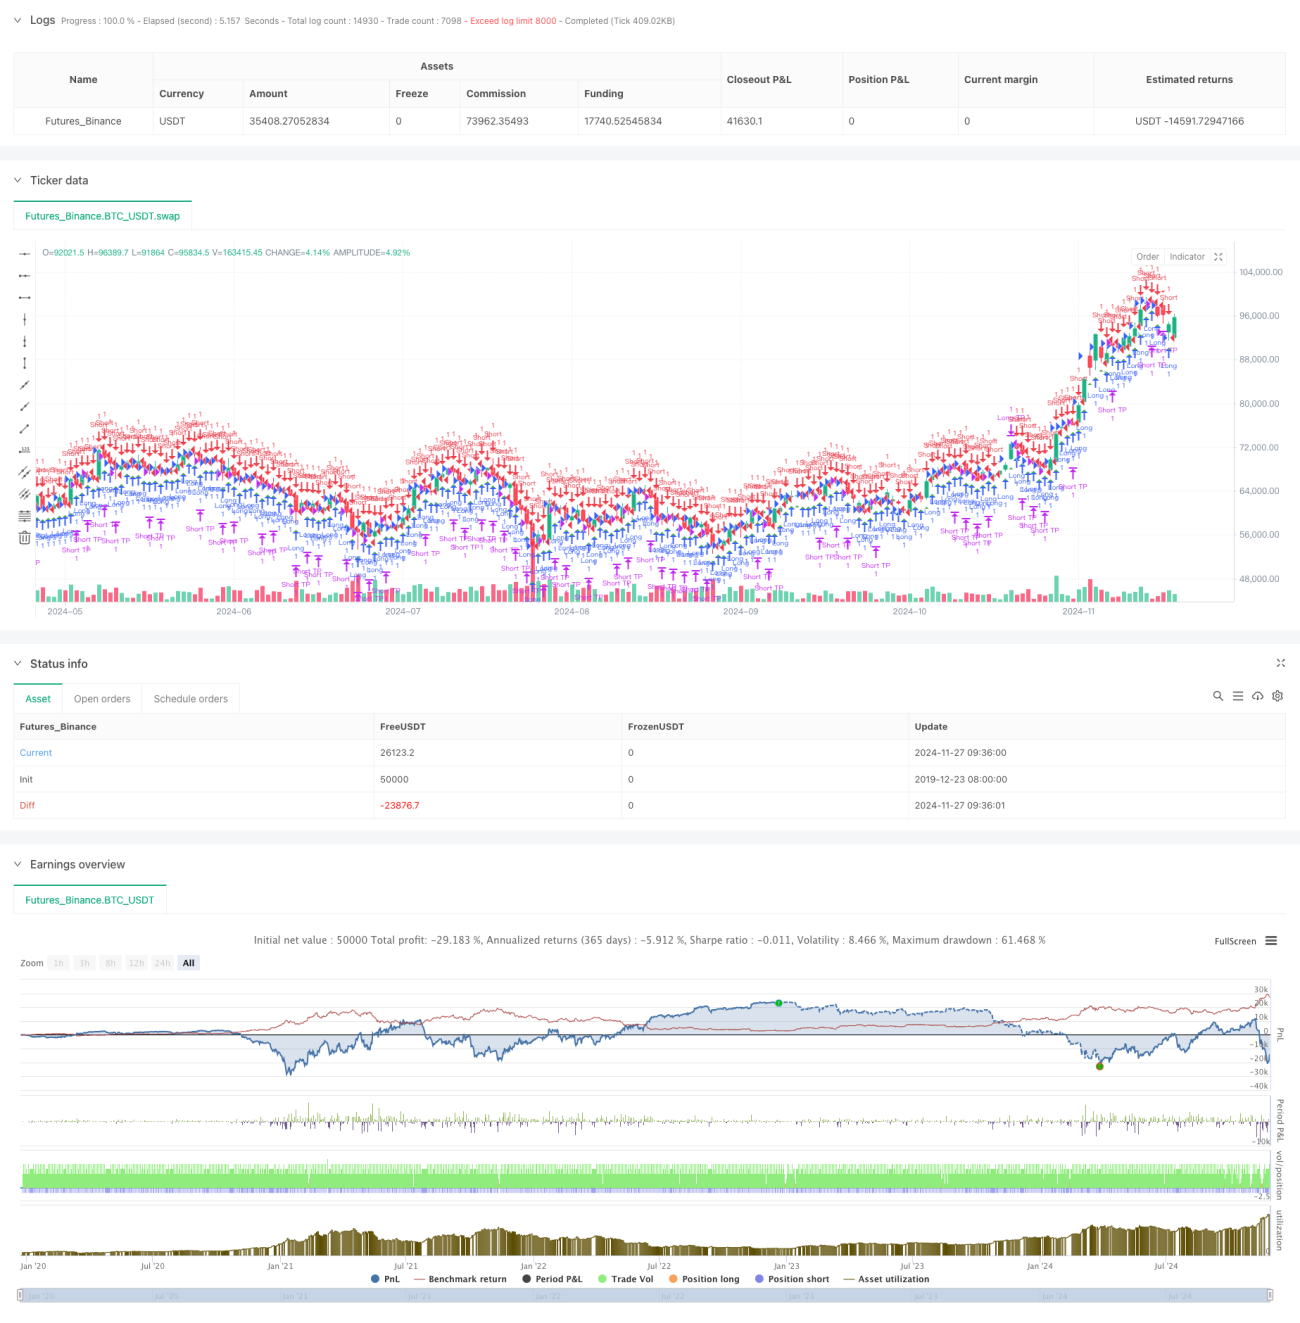
これは,ダイナミックなリスク管理と固定利益目標を組み合わせた,公正価値ギャップ (FVG) に基づく取引戦略である.この戦略は15分間の周期で動作し,市場内の価格ギャップを特定して潜在的な取引機会を捉える.2023年11月から2024年8月までの回顧データによると,この戦略は,284.40%の純利益率を達成し,合計153件の取引を完了し,その中では71.24%の利益率と2.422の利益因子を達成した.
戦略原則
戦略の核心は,連続した3つのK線間の価格関係を監視することによって,公正価値のギャップを識別することです.具体的には:
- 多頭FVG形成条件:現在のK線の一つの最高値が前2つのK線の一つの最低値より低い
- 空頭FVG形成条件:現在の1つのK線の最低価格は前2つのK線の最高価格より高い
- 入口信号は,FVGの<unk>値パラメータによって制御され,穴のサイズが価格の一定パーセントを超えるとのみトリガーされます.
- リスク管理 口座の固定利得率 ((1%) を止損基準として採用
- 固定ポイント (50ポイント) を採用した収益目標
戦略的優位性
- リスク管理の科学は合理的:口座の利権比率の停止により,ダイナミックなリスク管理が可能
- 取引のルールは明確です. 固定収益目標を使用し,主観的な判断を避けます.
- 優れたパフォーマンス:高い<unk>率と収益因子は,戦略が良好な安定性を示す
- シンプルな実装:コードの論理が明確で,理解し,維持しやすい
- 適応性:異なる市場環境にパラメータで適応できる
戦略リスク
- 市場変動のリスク: 高い波動性のある市場では,固定ポイントの利益目標が柔軟性がない可能性があります.
- スキットリスク:頻繁に取引すると,スキットコストが高くなります.
- パラメータ依存: 策略のパフォーマンスは,FVGの<unk>値の設定に強く依存する
- 偽突破リスク:一部のFVG信号は偽突破であり,追加の確認指標が必要である
- 資金管理リスク: 固定比率のストップは,連続的な損失の場合,資金が急激に縮小する可能性があります.
戦略最適化の方向性
- 市場変動指数導入,収益目標の動的調整
- トレンドフィルターを追加し,横軸市場での取引を避ける
- 複数のタイムサイクル確認メカニズムの開発
- ポジション管理アルゴリズムの最適化,浮動ポジションシステムの導入
- 取引時間フィルターを追加し,高波動期を避ける
- 信号強度評価システムを開発し,高品質の取引機会を<unk>出
要約する
この戦略は,公正価値ギャップ理論と科学的リスク管理方法の組み合わせにより,良好な取引効果を示している.戦略の高利率と安定した収益因子は,実際の戦いの価値を示している.推奨された最適化の方向によって,戦略はさらに向上する余地がある.トレーダーは,実用化する前に充分なパラメータ最適化と裏付けを推奨している.
Source
Pine
/*backtest
start: 2019-12-23 08:00:00
end: 2024-11-28 00:00:00
period: 1d
basePeriod: 1d
exchanges: [{"eid":"Futures_Binance","currency":"BTC_USDT"}]
*/

//@version=5
strategy("Fair Value Gap Strategy with % SL and Fixed TP", overlay=true, initial_capital=500, default_qty_type=strategy.fixed, default_qty_value=1)

// ParametersStrategy parameters
Related strategies
Comment
All comments (0)
No data
- 1