
1
Follow
1781
Followers
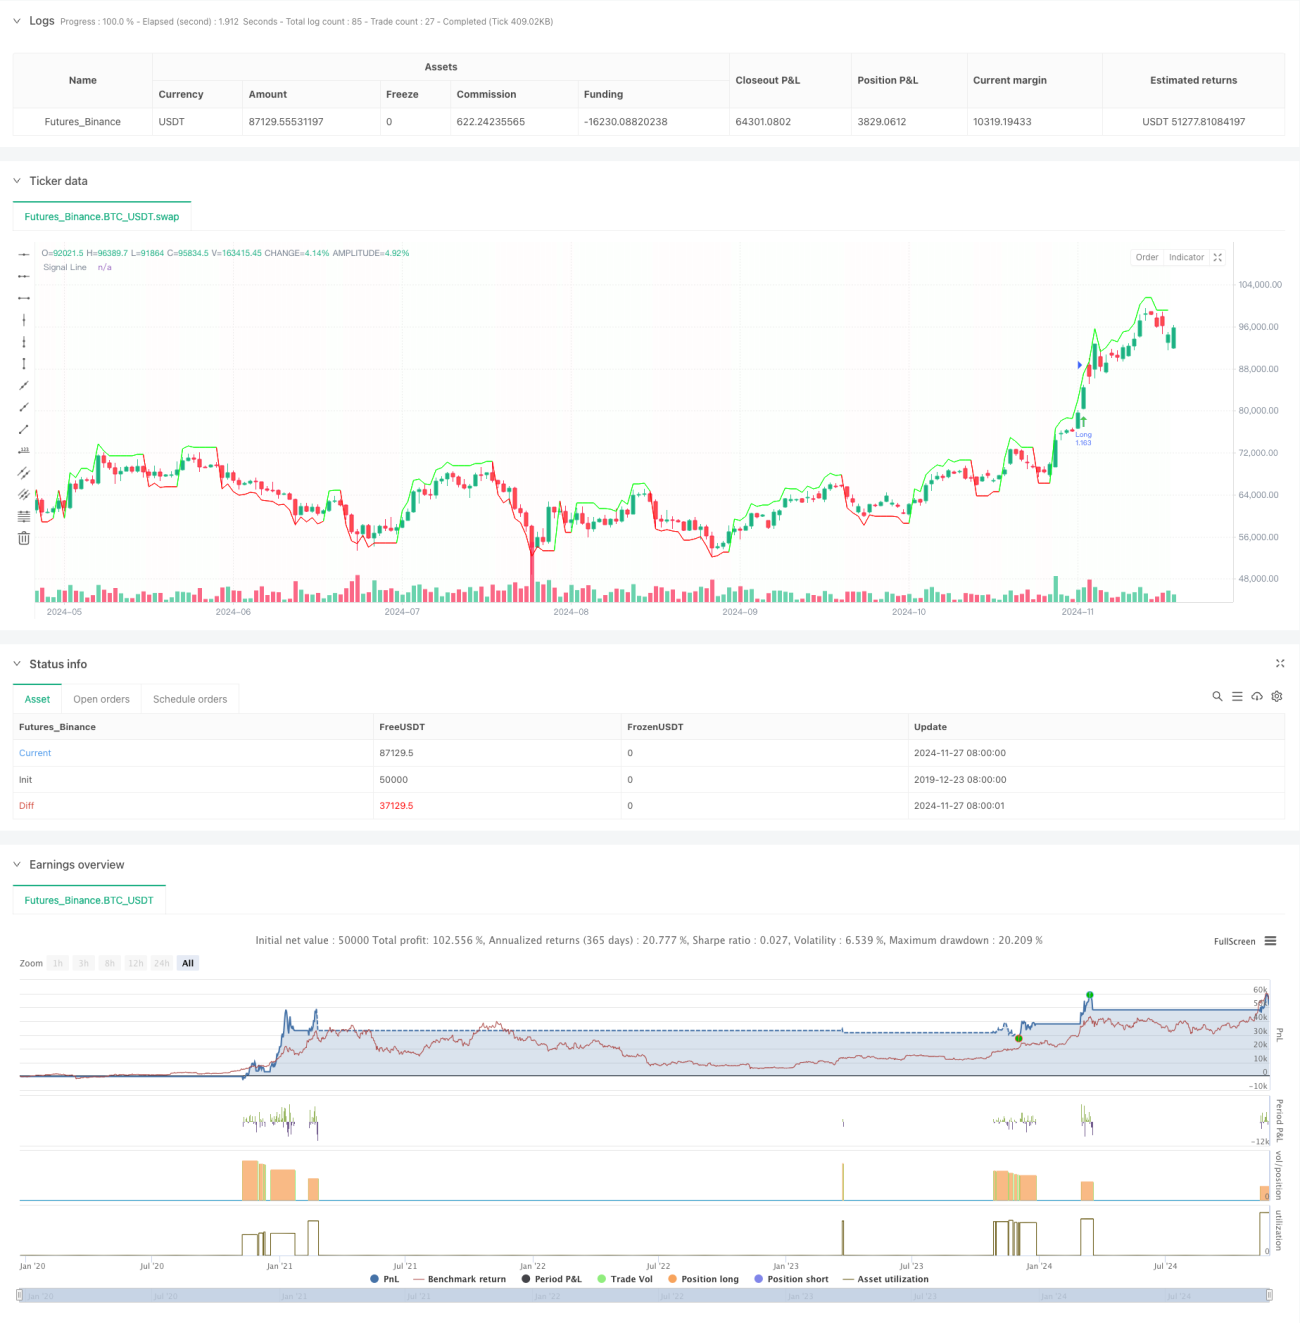
概要
この戦略は,多時間枠分析に基づく取引システムで,ボリンジャー帯,ハル移動平均,加重移動平均を組み合わせて取引シグナルを生成する.戦略は,主に1時間の時間枠で動作し,5分,1時間,3時間の3つの時間周期の市場データを統合し,複数の技術指標の組み合わせによって取引機会を確認する.戦略は,ダイナミックなストップ・ストップ・ロスの仕組みを採用し,口座権益に応じて自動的にポジションサイズを調整し,リスクを効果的に制御する.
戦略原則
戦略の核心論理は,複数の技術指標の交叉確認に基づいている.複数の時間周期で同時に価格と各種の均線の関係を監視する.これには,5分周期の加重移動平均 (VWMA),1時間周期の加重移動平均 (WMA),3時間周期のハル移動平均 (HMA) が含まれる.価格がすべての時間周期の指標の上位にあるとき,システムは価格突破時に多信号を発生させる.逆に,価格がすべての指標の下位にあるとき,システムは価格突破時に空信号を発生させる.戦略はまた,偏差計算 (deviation) を導入し,ダイナミックな入場場場と出口を設定し,取引の柔軟性を高める.
戦略的優位性
- 複数のタイムサイクル分析により,偽突破のリスクを低減し,取引信号の信頼性を高めます.
- ダイナミックなストップ・ストップ・ロスの設定により,異なる市場環境に対応できます.
- 口座権益に基づくポジション管理により,資金の合理的な使用が保証されます.
- 複数の出場メカニズムの選択は,戦略の適応性を高めています.
- 分析と判断を容易にするために,明確な取引シグナル表示を提供するグラフィカルインタフェース
- 取引決定の正確さを高めるために,複数の成熟した技術指標を統合
戦略リスク
- 複数の指標を使用すると,取引信号が遅れる可能性があります.
- 不安定な市場では、誤ったブレイクアウトシグナルが頻繁に発生する可能性がある
- 固定ストップ・ストラスト比率は,すべての市場状況に適していない可能性があります.
- 複数の時間周期のデータ処理は,戦略の実行の複雑さを増加させる可能性があります.
- 高波動性のある市場では,滑りやすいリスクがある
戦略最適化の方向性
- 利益確定と損切りレベルを動的に調整するボラティリティ指標を導入
- 市場環境の認識機能を追加し,異なる市場状態で異なるパラメータ設定を使用
- シグナルフィルタリングを最適化し,偽突破による損失を減らす
- 取引量分析の追加により,突破信号の信頼性が向上
- 戦略の安定性を高めるための自己適応のパラメータ最適化メカニズムの開発
要約する
この戦略は,複数のタイムサイクル分析と複数の技術指標を組み合わせて,比較的完全な取引システムを構築している.戦略の優点は,信号の信頼性とリスク管理の有効性にあるが,同時に,信号の遅れやパラメータの最適化などの問題もある.継続的な最適化と改善により,戦略は,異なる市場環境で安定したパフォーマンスを維持すると見込まれている.
Source
Pine
Strategy parameters
Comment
All comments (0)
No data
- 1