
この戦略は,ダイナミックな信号線 ((DSL),波動率,動向指標を組み合わせた総合的な取引システムである.この戦略は,ダイナミックな値と自調的な波動帯の方法によって,市場動向を効果的に識別し,動向指標を使用して信号フィルタリングを行い,正確な取引タイミングを把握する.システムは,ダイナミックな止損とリスクに基づく収益率の目標設定を含む完全なリスク管理機構を設計している.
戦略の核心的な論理は,以下の3つの主要な要素に基づいています.
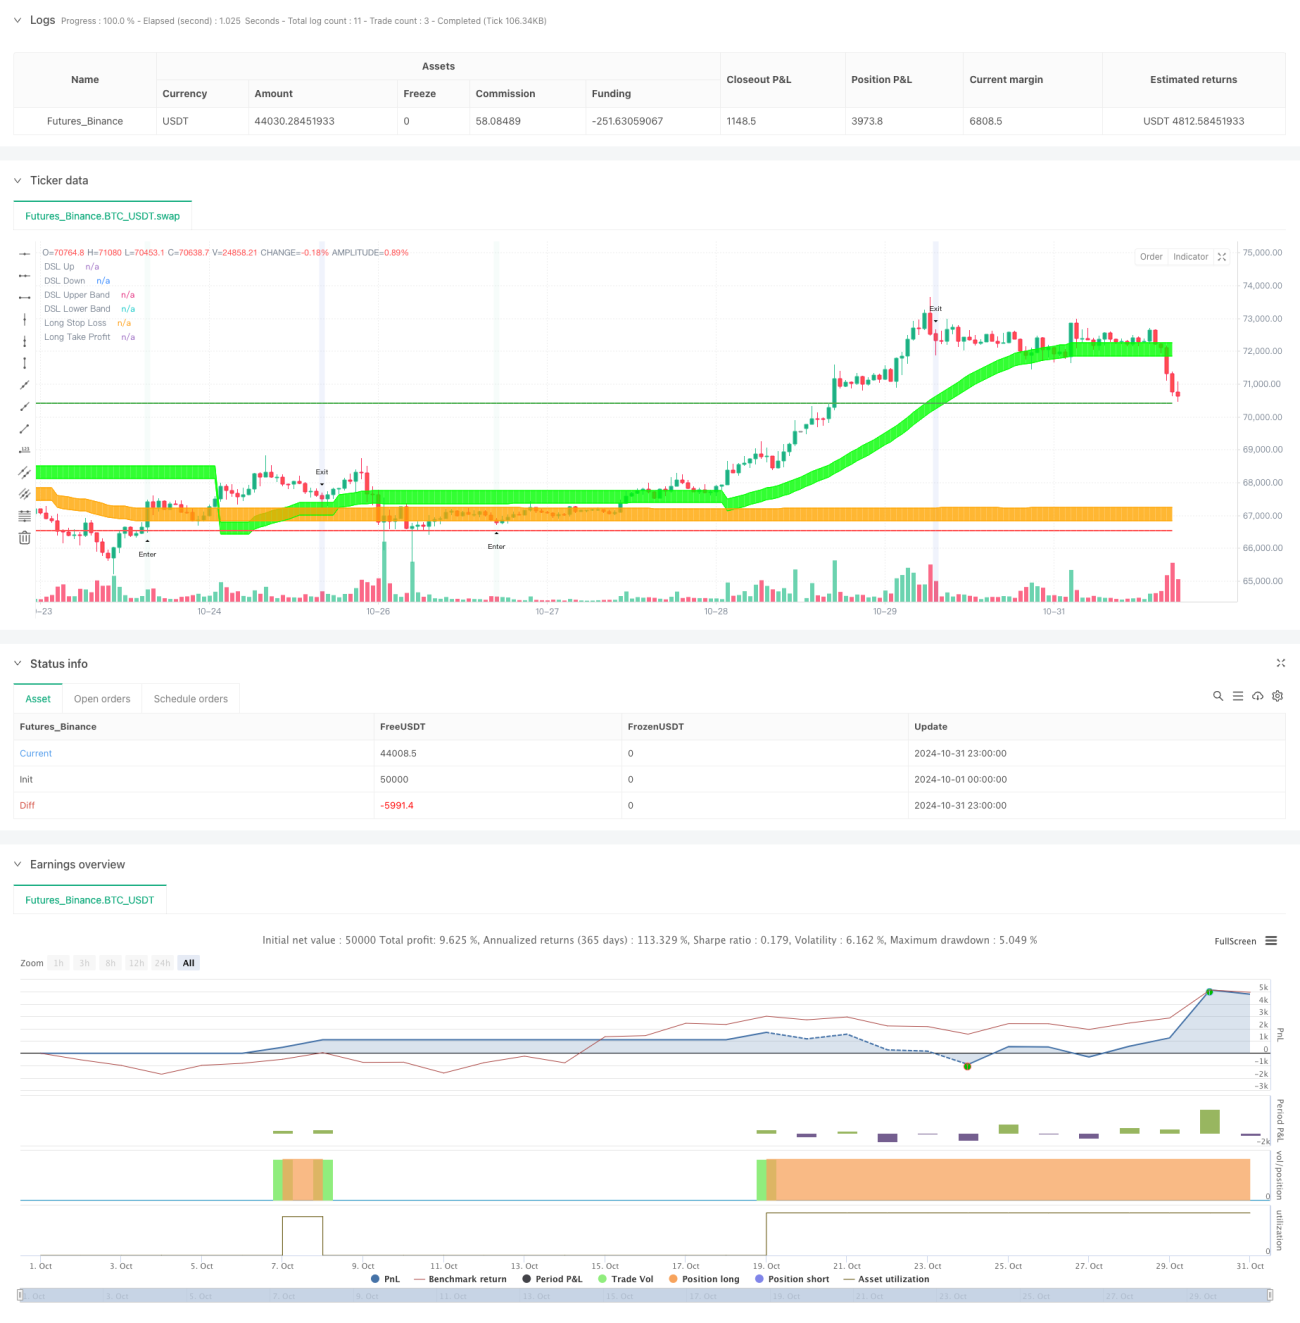
まず,動的信号線システムで,移動平均に基づいて動的上下軌道線を計算する.これらの軌道線は,市場の最近の高点と低点に応じて自動的に位置を調整し,トレンドへの自主的なトラッキングを実現する.システムは,ATR指標と組み合わせて,トレンドの強さを確認するために動的波動帯を構成し,ストップロスを設定する.
次に,運動分析システムで,ゼロの遅延指数移動平均 (ZLEMA) により最適化されたRSI指標を使用します.RSIにダイナミックシグナルラインの概念を適用することにより,システムは,超買い超売り領域をより正確に識別し,運動突破信号を生成します.
3つ目は,信号統合メカニズムである. 取引信号は,トレンド確認と動力の突破の両方の条件を同時に満たさなければならない. 多頭入場は,価格が上線を突破して軌道上にとどまるように要求し,RSIは下部の動的信号ラインを突破する. 空気信号は,逆の条件を同時に満たさなければならない.
この戦略は,ダイナミックなシグナルラインと動向指標の革新的な組み合わせにより,市場動向を効果的に捉えることができます. 完善したリスク管理機構とシグナルフィルタリングシステムは,強力な実戦的な応用価値を有します. 継続的な最適化とパラメータ調整により,戦略は,異なる市場環境で安定したパフォーマンスを維持すると見込まれています.
/*backtest
start: 2024-10-01 00:00:00
end: 2024-10-31 23:59:59
period: 1h
basePeriod: 1h
exchanges: [{"eid":"Futures_Binance","currency":"BTC_USDT"}]
*/
// This Pine Script™ code is subject to the terms of the Mozilla Public License 2.0 at https://mozilla.org/MPL/2.0/
// © DailyPanda
//@version=5
strategy("DSL Strategy [DailyPanda]",
initial_capital = 2000,
commission_value=0.00,
slippage=3,
overlay = true)
//--------------------------------------------------------------------------------------------------------------------
// USER INPUTS
//--------------------------------------------------------------------------------------------------------------------
// DSL Indicator Inputs CP
int len = input.int(34, "Length", group="CP") // Length for calculating DSL
int offset = input.int(30, "Offset", group="CP") // Offset for threshold levels
float width = input.float(1, "Bands Width", step = 0.1, maxval = 2, minval = 0.5, group="CP") // Width for ATR-based bands
float risk_reward = input.float(1.5, "Risk Reward", group="Risk Mgmt") // Risk Reward ratio
// Colors for upper and lower trends
color upper_col = input.color(color.lime, "+", inline = "col")
color lower_col = input.color(color.orange, "-", inline = "col")
// DSL-BELUGA
len_beluga = input.int(10, "Beluga Length", group="BELUGA")
dsl_mode_inp = input.string("Fast", "DSL Lines Mode", options=["Fast", "Slow"], group="BELUGA")
dsl_mode = dsl_mode_inp == "Fast" ? 2 : 1
// Colors for DSL-BELUGA
color color_up = #8BD8BD
color color_dn = #436cd3
i_lossPct = input.int(defval=100, title="% max day DD", minval=1, maxval=100, step=1, group="Risk Management")
i_goal = input.bool(title="Enable Daily Goal", defval=false, group="Risk Management")
i_goalPct = input.int(defval=4, title="% Daily Goal", minval=1, step=1, group="Risk Management")
//############################## RISK MANAGEMENT ##############################
// Set maximum intraday loss to our lossPct input
// strategy.risk.max_intraday_loss(i_lossPct, strategy.percent_of_equity)
//strategy.risk.max_intraday_loss(value=1200, type=strategy.cash)
// Store equity value from the beginning of the day
eqFromDayStart = ta.valuewhen(ta.change(dayofweek) > 0, strategy.equity, 0)
// Calculate change of the current equity from the beginning of the current day
eqChgPct = 100 * ((strategy.equity - eqFromDayStart - strategy.openprofit) / (strategy.equity-strategy.openprofit))
f_stopGain = eqChgPct >= i_goalPct and i_goal ? true : false
//--------------------------------------------------------------------------------------------------------------------
// INDICATOR CALCULATIONS
//--------------------------------------------------------------------------------------------------------------------
// Function to calculate DSL lines based on price
dsl_price(float price, int len) =>
// Initialize DSL lines
float dsl_up = na
float dsl_dn = na
float sma = ta.sma(price, len)
// Dynamic upper and lower thresholds calculated with offset
float threshold_up = ta.highest(len)[offset]
float threshold_dn = ta.lowest(len)[offset]
// Calculate the DSL upper and lower lines based on price compared to the thresholds
dsl_up := price > threshold_up ? sma : nz(dsl_up[1])
dsl_dn := price < threshold_dn ? sma : nz(dsl_dn[1])
// Return both DSL lines
[dsl_up, dsl_dn]
// Function to calculate DSL bands based on ATR and width multiplier
dsl_bands(float dsl_up, float dsl_dn) =>
float atr = ta.atr(200) * width // ATR-based calculation for bands
float upper = dsl_up - atr // Upper DSL band
float lower = dsl_dn + atr // Lower DSL band
[upper, lower]
// Get DSL values based on the closing price
[dsl_up, dsl_dn] = dsl_price(close, len)
// Calculate the bands around the DSL lines
[dsl_up1, dsl_dn1] = dsl_bands(dsl_up, dsl_dn)
//--------------------------------------------------------------------------------------------------------------------
// DSL-BELUGA INDICATOR CALCULATIONS
//--------------------------------------------------------------------------------------------------------------------
// Calculate RSI with a period of 10
float RSI = ta.rsi(close, 10)
// Zero-Lag Exponential Moving Average function
zlema(src, length) =>
int lag = math.floor((length - 1) / 2)
float ema_data = 2 * src - src[lag]
float ema2 = ta.ema(ema_data, length)
ema2
// Discontinued Signal Lines function
dsl_lines(src, length)=>
float up = 0.
float dn = 0.
up := (src > ta.sma(src, length)) ? nz(up[1]) + dsl_mode / length * (src - nz(up[1])) : nz(up[1])
dn := (src < ta.sma(src, length)) ? nz(dn[1]) + dsl_mode / length * (src - nz(dn[1])) : nz(dn[1])
[up, dn]
// Calculate DSL lines for RSI
[lvlu, lvld] = dsl_lines(RSI, len_beluga)
// Calculate DSL oscillator using ZLEMA of the average of upper and lower DSL Lines
float dsl_osc = zlema((lvlu + lvld) / 2, 10)
// Calculate DSL Lines for the oscillator
[level_up, level_dn] = dsl_lines(dsl_osc, 10)
// Detect crossovers for signal generation
bool up_signal = ta.crossover(dsl_osc, level_dn) and dsl_osc < 55
bool dn_signal = ta.crossunder(dsl_osc, level_up) and dsl_osc > 50
//--------------------------------------------------------------------------------------------------------------------
// VISUALIZATION
//--------------------------------------------------------------------------------------------------------------------
// Plot the DSL lines on the chart
plot_dsl_up = plot(dsl_up, color=color.new(upper_col, 80), linewidth=1, title="DSL Up")
plot_dsl_dn = plot(dsl_dn, color=color.new(lower_col, 80), linewidth=1, title="DSL Down")
// Plot the DSL bands
plot_dsl_up1 = plot(dsl_up1, color=color.new(upper_col, 80), linewidth=1, title="DSL Upper Band")
plot_dsl_dn1 = plot(dsl_dn1, color=color.new(lower_col, 80), linewidth=1, title="DSL Lower Band")
// Fill the space between the DSL lines and bands with color
fill(plot_dsl_up, plot_dsl_up1, color=color.new(upper_col, 80))
fill(plot_dsl_dn, plot_dsl_dn1, color=color.new(lower_col, 80))
// Plot signals on the chart
plotshape(up_signal, title="Buy Signal", style=shape.triangleup, location=location.belowbar, size=size.tiny, text="Enter")
plotshape(dn_signal, title="Sell Signal", style=shape.triangledown, location=location.abovebar, size=size.tiny, text="Exit")
// Color the background on signal occurrences
bgcolor(up_signal ? color.new(color_up, 90) : na, title="Up Signal Background", editable = false)
bgcolor(dn_signal ? color.new(color_dn, 90) : na, title="Down Signal Background", editable = false)
//--------------------------------------------------------------------------------------------------------------------
// STRATEGY CONDITIONS AND EXECUTION
//--------------------------------------------------------------------------------------------------------------------
// Variables to hold stop loss and take profit prices
var float long_stop_loss_price = na
var float long_take_profit_price = na
var float short_stop_loss_price = na
var float short_take_profit_price = na
float pos_size = math.abs(strategy.position_size)
// Long Entry Conditions
bool long_condition1 = not na(dsl_up1) and not na(dsl_dn) and dsl_up1 > dsl_dn
bool long_condition2 = open > dsl_up and close > dsl_up and open[1] > dsl_up and close[1] > dsl_up and open[2] > dsl_up and close[2] > dsl_up
bool long_condition3 = up_signal and pos_size == 0
bool long_condition = long_condition1 and long_condition2 and long_condition3 and (not f_stopGain)
// Short Entry Conditions
bool short_condition1 = not na(dsl_dn1) and not na(dsl_up) and dsl_dn < dsl_up1
bool short_condition2 = open < dsl_dn1 and close < dsl_dn1 and open[1] < dsl_dn1 and close[1] < dsl_dn1 and open[2] < dsl_dn1 and close[2] < dsl_dn1
bool short_condition3 = dn_signal and pos_size == 0
bool short_condition = short_condition1 and short_condition2 and short_condition3 and (not f_stopGain)
// Long Trade Execution
if (long_condition and not na(dsl_up1))
long_stop_loss_price := dsl_up1
float risk = close - long_stop_loss_price
if (risk > 0)
long_take_profit_price := close + risk * risk_reward
strategy.entry("Long", strategy.long)
strategy.exit("Exit Long", from_entry="Long", stop=long_stop_loss_price, limit=long_take_profit_price)
else if (strategy.position_size <= 0)
// Reset when not in a long position
long_stop_loss_price := na
long_take_profit_price := na
// Short Trade Execution
if (short_condition and not na(dsl_dn1))
short_stop_loss_price := dsl_dn1
float risk = short_stop_loss_price - close
if (risk > 0)
short_take_profit_price := close - risk * risk_reward
strategy.entry("Short", strategy.short)
strategy.exit("Exit Short", from_entry="Short", stop=short_stop_loss_price, limit=short_take_profit_price)
else if (strategy.position_size >= 0)
// Reset when not in a short position
short_stop_loss_price := na
short_take_profit_price := na
//--------------------------------------------------------------------------------------------------------------------
// PLOTTING STOP LOSS AND TAKE PROFIT LEVELS
//--------------------------------------------------------------------------------------------------------------------
// Plot the stop loss and take profit levels only when in a position
float plot_long_stop_loss = strategy.position_size > 0 ? long_stop_loss_price : na
float plot_long_take_profit = strategy.position_size > 0 ? long_take_profit_price : na
float plot_short_stop_loss = strategy.position_size < 0 ? short_stop_loss_price : na
float plot_short_take_profit = strategy.position_size < 0 ? short_take_profit_price : na
plot(plot_long_stop_loss, title="Long Stop Loss", color=color.red, linewidth=2, style=plot.style_linebr, editable=false)
plot(plot_long_take_profit, title="Long Take Profit", color=color.green, linewidth=2, style=plot.style_linebr, editable=false)
plot(plot_short_stop_loss, title="Short Stop Loss", color=color.red, linewidth=2, style=plot.style_linebr, editable=false)
plot(plot_short_take_profit, title="Short Take Profit", color=color.green, linewidth=2, style=plot.style_linebr, editable=false)