
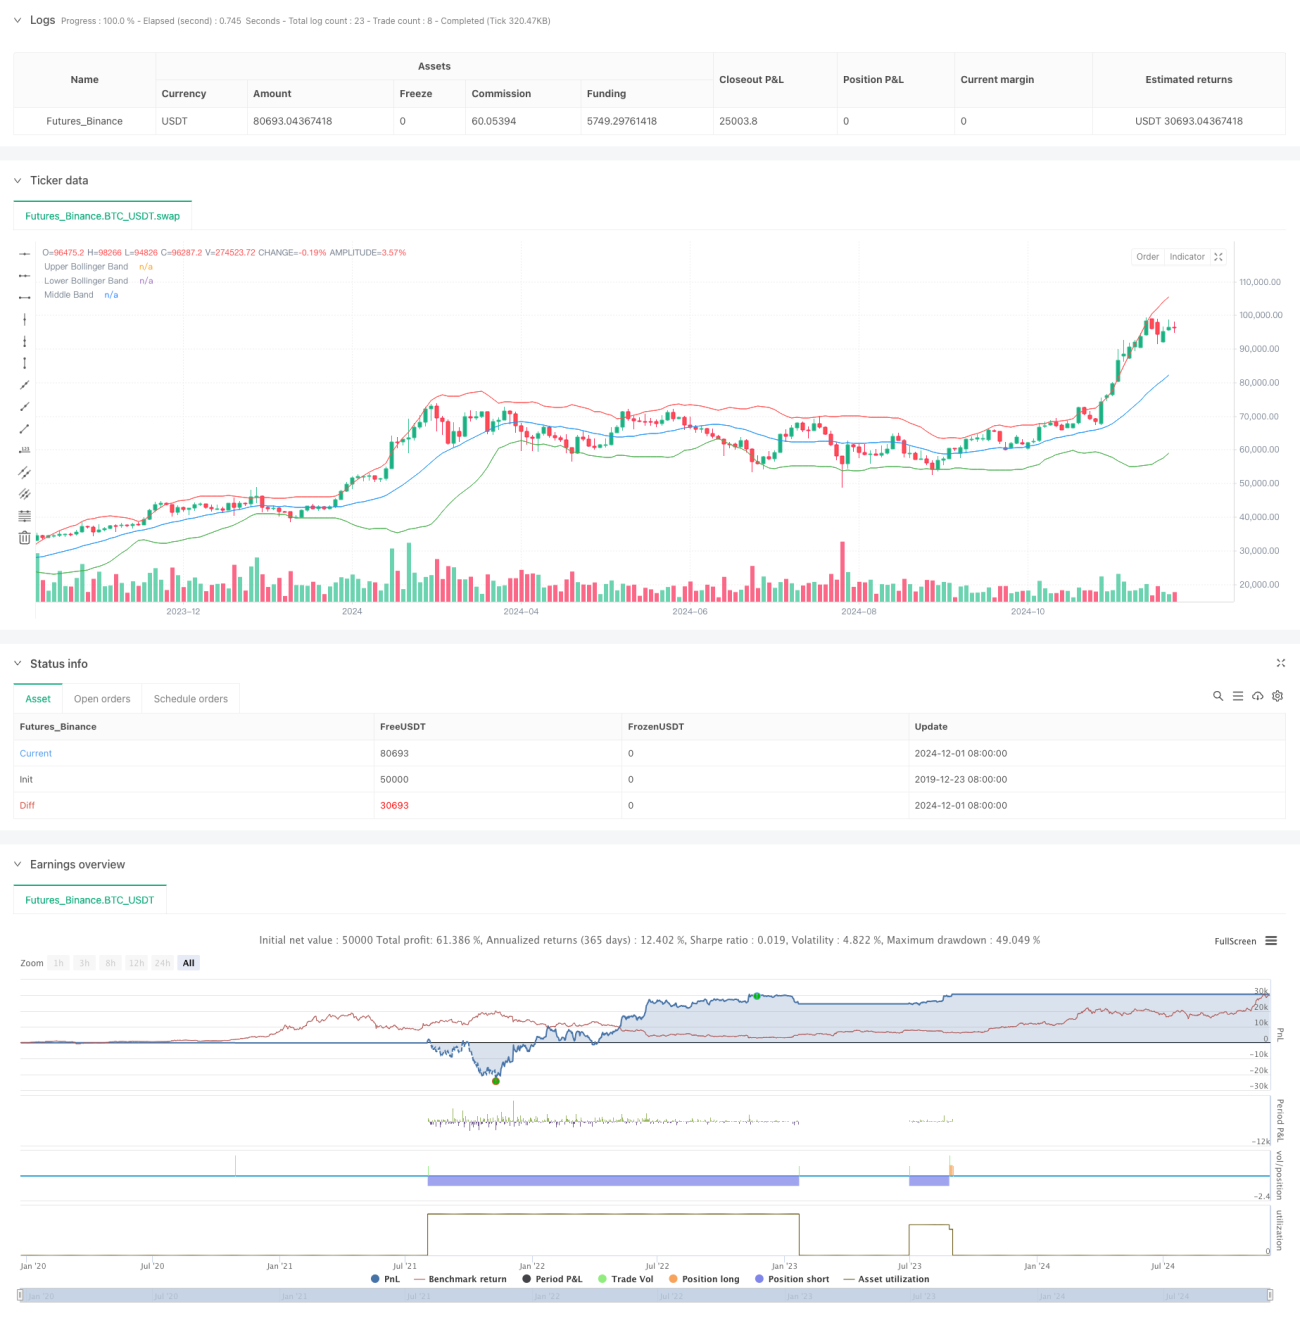
この戦略は,ブリン帯の指標と価格突破を組み合わせた高周波取引システムである.この戦略は,価格とブリン帯の位置関係を監視し,前期の高低点突破シグナルと組み合わせて,市場がオーバーバイオーバーセールが発生したときに逆転取引を行う.このシステムは,1:1のリスクと利益の比率を採用し,ストップ・ロスを設定し,各キー価格を視覚的に表示し,トレーダーが市場動向を直視的に理解するのを助ける.
戦略の核心的な論理は,2つの主要な判断条件に基づいています:価格が前期高点を破り,前期高点がブリン帯の下線以下にあるとき,多信号をトリガーします.価格が前期低点を破り,前期低点がブリン帯上線上のとき,空信号をトリガーします.ブリン帯のパラメータは,20周期移動平均と2倍標準差を用いて,市場の波動範囲と超買い超売り区域システムを判断します.取引信号をトリガーした後,自動的に対応するストップポイントとターゲットポイントを設定し,異なるスタイルのラインで可視化します.
これは,複数の技術分析の概念を統合した完全な取引システムである.ブリン帯の指標と価格の突破を組み合わせることで,戦略は,市場の超買い超売り領域で反転の機会を捕捉することができる.一定の最適化余地があるものの,システムの基礎的枠組みは,優れた拡張性と実用的な価値を有している.合理的なリスク管理とパラメータの最適化により,この戦略は,実際の取引で安定した収益を期待している.
/*backtest
start: 2019-12-23 08:00:00
end: 2024-12-03 00:00:00
period: 2d
basePeriod: 2d
exchanges: [{"eid":"Futures_Binance","currency":"BTC_USDT"}]
*/
//@version=5
strategy("Bollinger Band Scalping", overlay=true)
// Input for Bollinger Bands length and standard deviation
bbLength = input(20, title="Bollinger Bands Length")
stdDev = input(2.0, title="Bollinger Bands Std Dev")
// Calculate and plot the Bollinger Bands
basis = ta.sma(close, bbLength)
deviation = stdDev * ta.stdev(close, bbLength)
upperBB = basis + deviation
lowerBB = basis - deviation
// Get previous candle's values
prevHigh = high[1] // Previous candle high
prevLow = low[1] // Previous candle low
// Buy Signal Condition: Current high crossed above previous high and previous high is below the lower Bollinger Band
buyCondition = ta.crossover(high, prevHigh) and (prevHigh < lowerBB[1])
// Sell Signal Condition: Current low crossed below previous low and previous low is above the upper Bollinger Band
sellCondition = ta.crossunder(low, prevLow) and (prevLow > upperBB[1])
// Entry and exit for Buy signals
if (buyCondition)
strategy.entry("Buy", strategy.long)
// Calculate target and stop loss
stopLossPrice = prevLow
targetPrice = prevHigh + (prevHigh - stopLossPrice) // 1:1 RR target
// Set stop loss and target orders
strategy.exit("Sell", "Buy", limit=targetPrice, stop=stopLossPrice)
// // Plot entry line
// line.new(x1=bar_index, y1=prevHigh, x2=bar_index + 12, y2=prevHigh, color=color.green, width=2, style=line.style_solid)
// // Plot stop loss line
// line.new(x1=bar_index, y1=stopLossPrice, x2=bar_index + 12, y2=stopLossPrice, color=color.red, width=1, style=line.style_dashed)
// // Plot target line
// line.new(x1=bar_index, y1=targetPrice, x2=bar_index + 12, y2=targetPrice, color=color.blue, width=2, style=line.style_solid)
// Entry and exit for Sell signals
if (sellCondition)
strategy.entry("Sell", strategy.short)
// Calculate target and stop loss
stopLossPriceSell = prevHigh
targetPriceSell = prevLow - (stopLossPriceSell - prevLow) // 1:1 RR target
// Set stop loss and target orders
strategy.exit("Cover", "Sell", limit=targetPriceSell, stop=stopLossPriceSell)
// // Plot entry line
// line.new(x1=bar_index, y1=prevLow, x2=bar_index + 12, y2=prevLow, color=color.red, width=2, style=line.style_solid)
// // Plot stop loss line
// line.new(x1=bar_index, y1=stopLossPriceSell, x2=bar_index + 12, y2=stopLossPriceSell, color=color.green, width=1, style=line.style_dashed)
// // Plot target line
// line.new(x1=bar_index, y1=targetPriceSell, x2=bar_index + 12, y2=targetPriceSell, color=color.blue, width=2, style=line.style_solid)
// Plotting Bollinger Bands with 70% transparency
plot(upperBB, color=color.red, title="Upper Bollinger Band", transp=70)
plot(lowerBB, color=color.green, title="Lower Bollinger Band", transp=70)
plot(basis, color=color.blue, title="Middle Band", transp=70)