ダイナミックサポートプライスアクショントレーディングシステム

1
Follow
1781
Followers
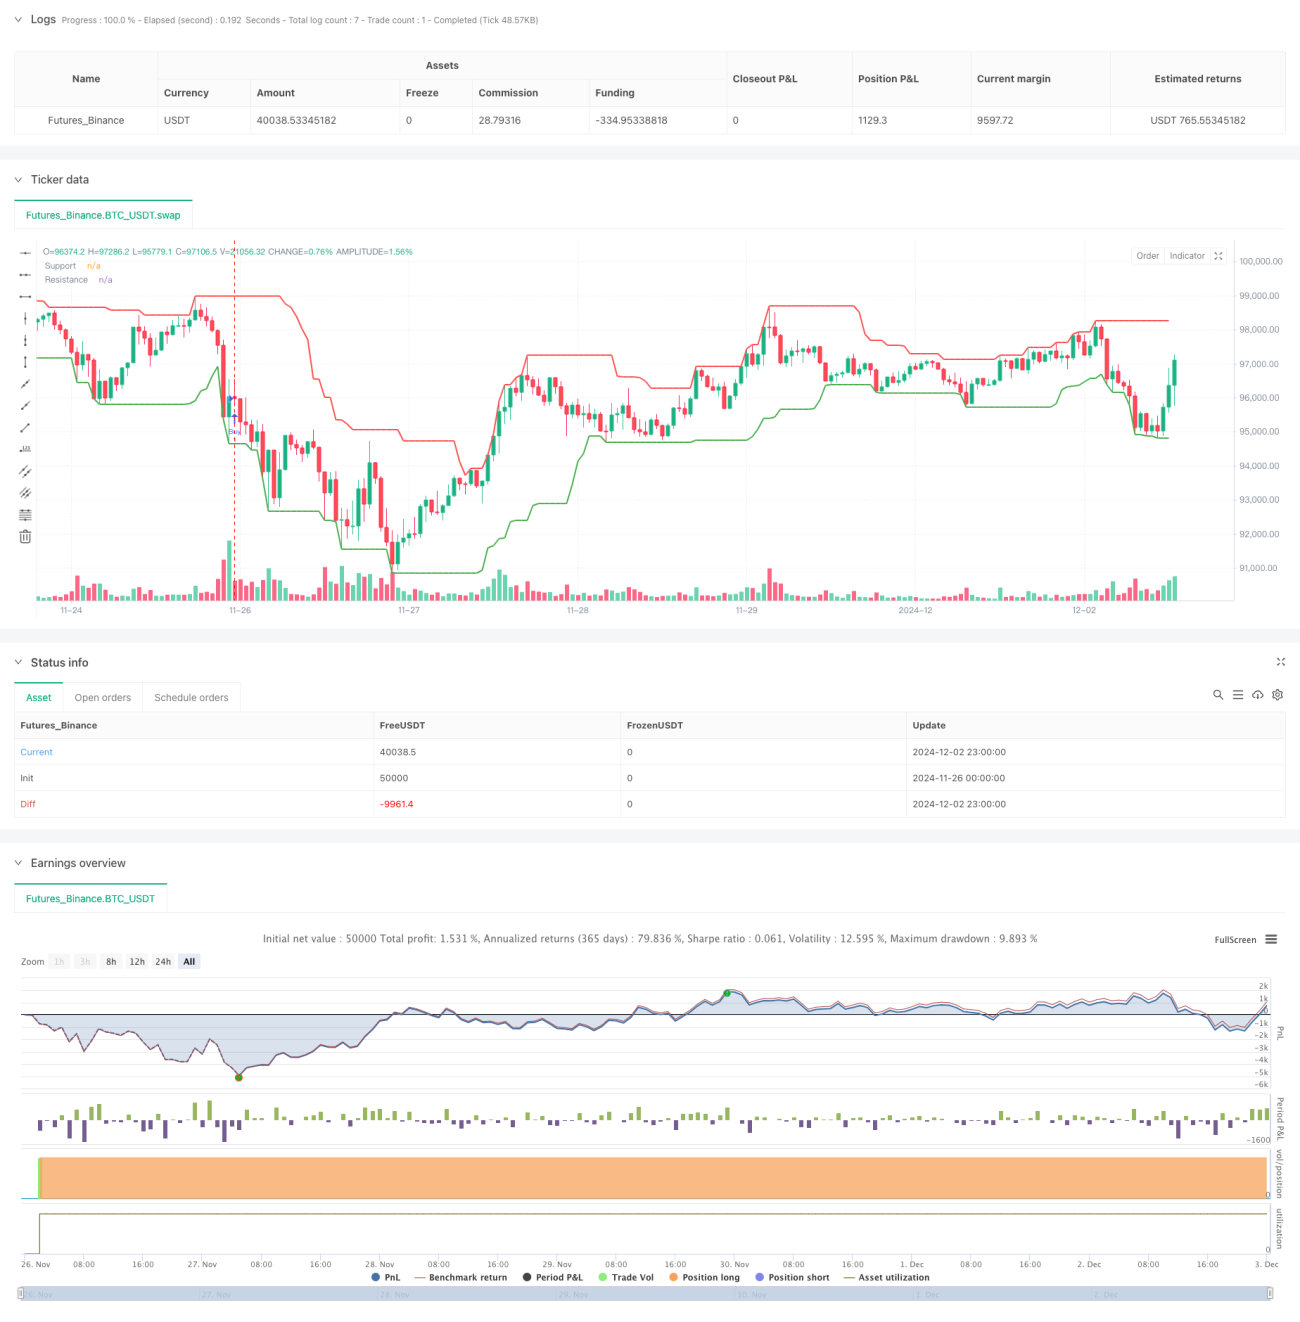
概要
この戦略は,価格行動とダイナミックなサポートとレジスタンス位置に基づく取引システムで,サポートとレジスタンス位置の近くで重要な価格パターンを識別することによって取引を行う.システムは,16サイクルのダイナミックなサポートとレジスタンス計算方法を採用し,市場における潜在的な反転の機会をキャプチャするために4つのクラシックな反転の形状 - 子<unk>線,流星線,十字星,針の形状を組み合わせている.
戦略原則
戦略の核心は,サポートとレジスタンス値を動的に計算して,価格活動の上下境界を形成することです.価格がこれらの重要なレベルに近づくと,システムは特定の<unk>図形状を反転信号として探します.入場条件は,価格がサポートのレジスタンス値の1.8%の範囲 ((デフォルトの感受性) の内での反転形状の出現を要求します.システムは,16%のストップと9.5%のストップを組み合わせた35%の資金管理ルールを使用し,各取引のリスクを約5.6%の口座総額で効果的に制御します.戦略は,Pine Scriptで実装され,完全な取引管理と視覚的な表示機能が含まれています.
戦略的優位性
- この戦略は,価格の形状とサポートレジスタンスという技術分析の最も信頼性の高い2つの要素を組み合わせて,取引信号の信頼性を高めています.
- 市場条件の変化に対応する,動的計算によるサポート抵抗位
- 資金管理とリスク管理の厳格な措置により,大規模な撤収を防止する
- 戦略の論理が明確で,パラメータは調整可能で,異なる市場状況に応じて最適化できます
- 入場信号は明快で,主観的な判断要素がない,自動取引に適しています.
戦略リスク
- 波動性高い市場では,抵抗点を支える効果が低下する可能性があります.
- 止損位置は比較的遠い (<16%),激しい状況では大きな損失を負う可能性があります.
- 取引頻度と正確性に重要な影響を与えるセンシビリティパラメータの設定
- 価格の動きにだけ依存すると,他の重要な市場信号が失われる可能性があります.
- 取引コストが戦略のリターンに与える影響を考慮する必要がある
戦略最適化の方向性
- 信号信頼性を高めるための補助確認指標として交差量導入
- 市場変動の動向に合わせて適応可能なセンシビリティパラメータの開発
- モバイルストップまたは分期ストップを使用することを検討するストップ設定を最適化する
- トレンドフィルターを追加し,強気なトレンドで逆転を避ける
- 市場状況に応じて取引規模を調整するダイナミックなポジション管理システムの開発
要約する
この価格行動に基づく取引戦略は,ダイナミックサポートのレジスタンスレベルとクラシック反転形態を組み合わせることで,トレーダーに体系化された取引方法を提供します.戦略の優点は,論理的明晰さとリスクの制御性にあるが,実際の取引効果に基づいて継続的な最適化が必要である.トレーダーは,実用化される前に十分なフィットバックとパラメータの最適化を行い,市場経験と組み合わせて戦略に個別的な調整を行うことをお勧めします.
Source
Pine
/*backtest
start: 2024-11-26 00:00:00
end: 2024-12-03 00:00:00
period: 1h
basePeriod: 1h
exchanges: [{"eid":"Futures_Binance","currency":"BTC_USDT"}]
*/

// This Pine Script™ code is subject to the terms of the Mozilla Public License 2.0 at https://mozilla.org/MPL/2.0/
// © felipemiransan

//@version=5Strategy parameters
Related strategies
Comment
All comments (0)
No data
- 1