1
フォロー
1750
フォロワー
概要
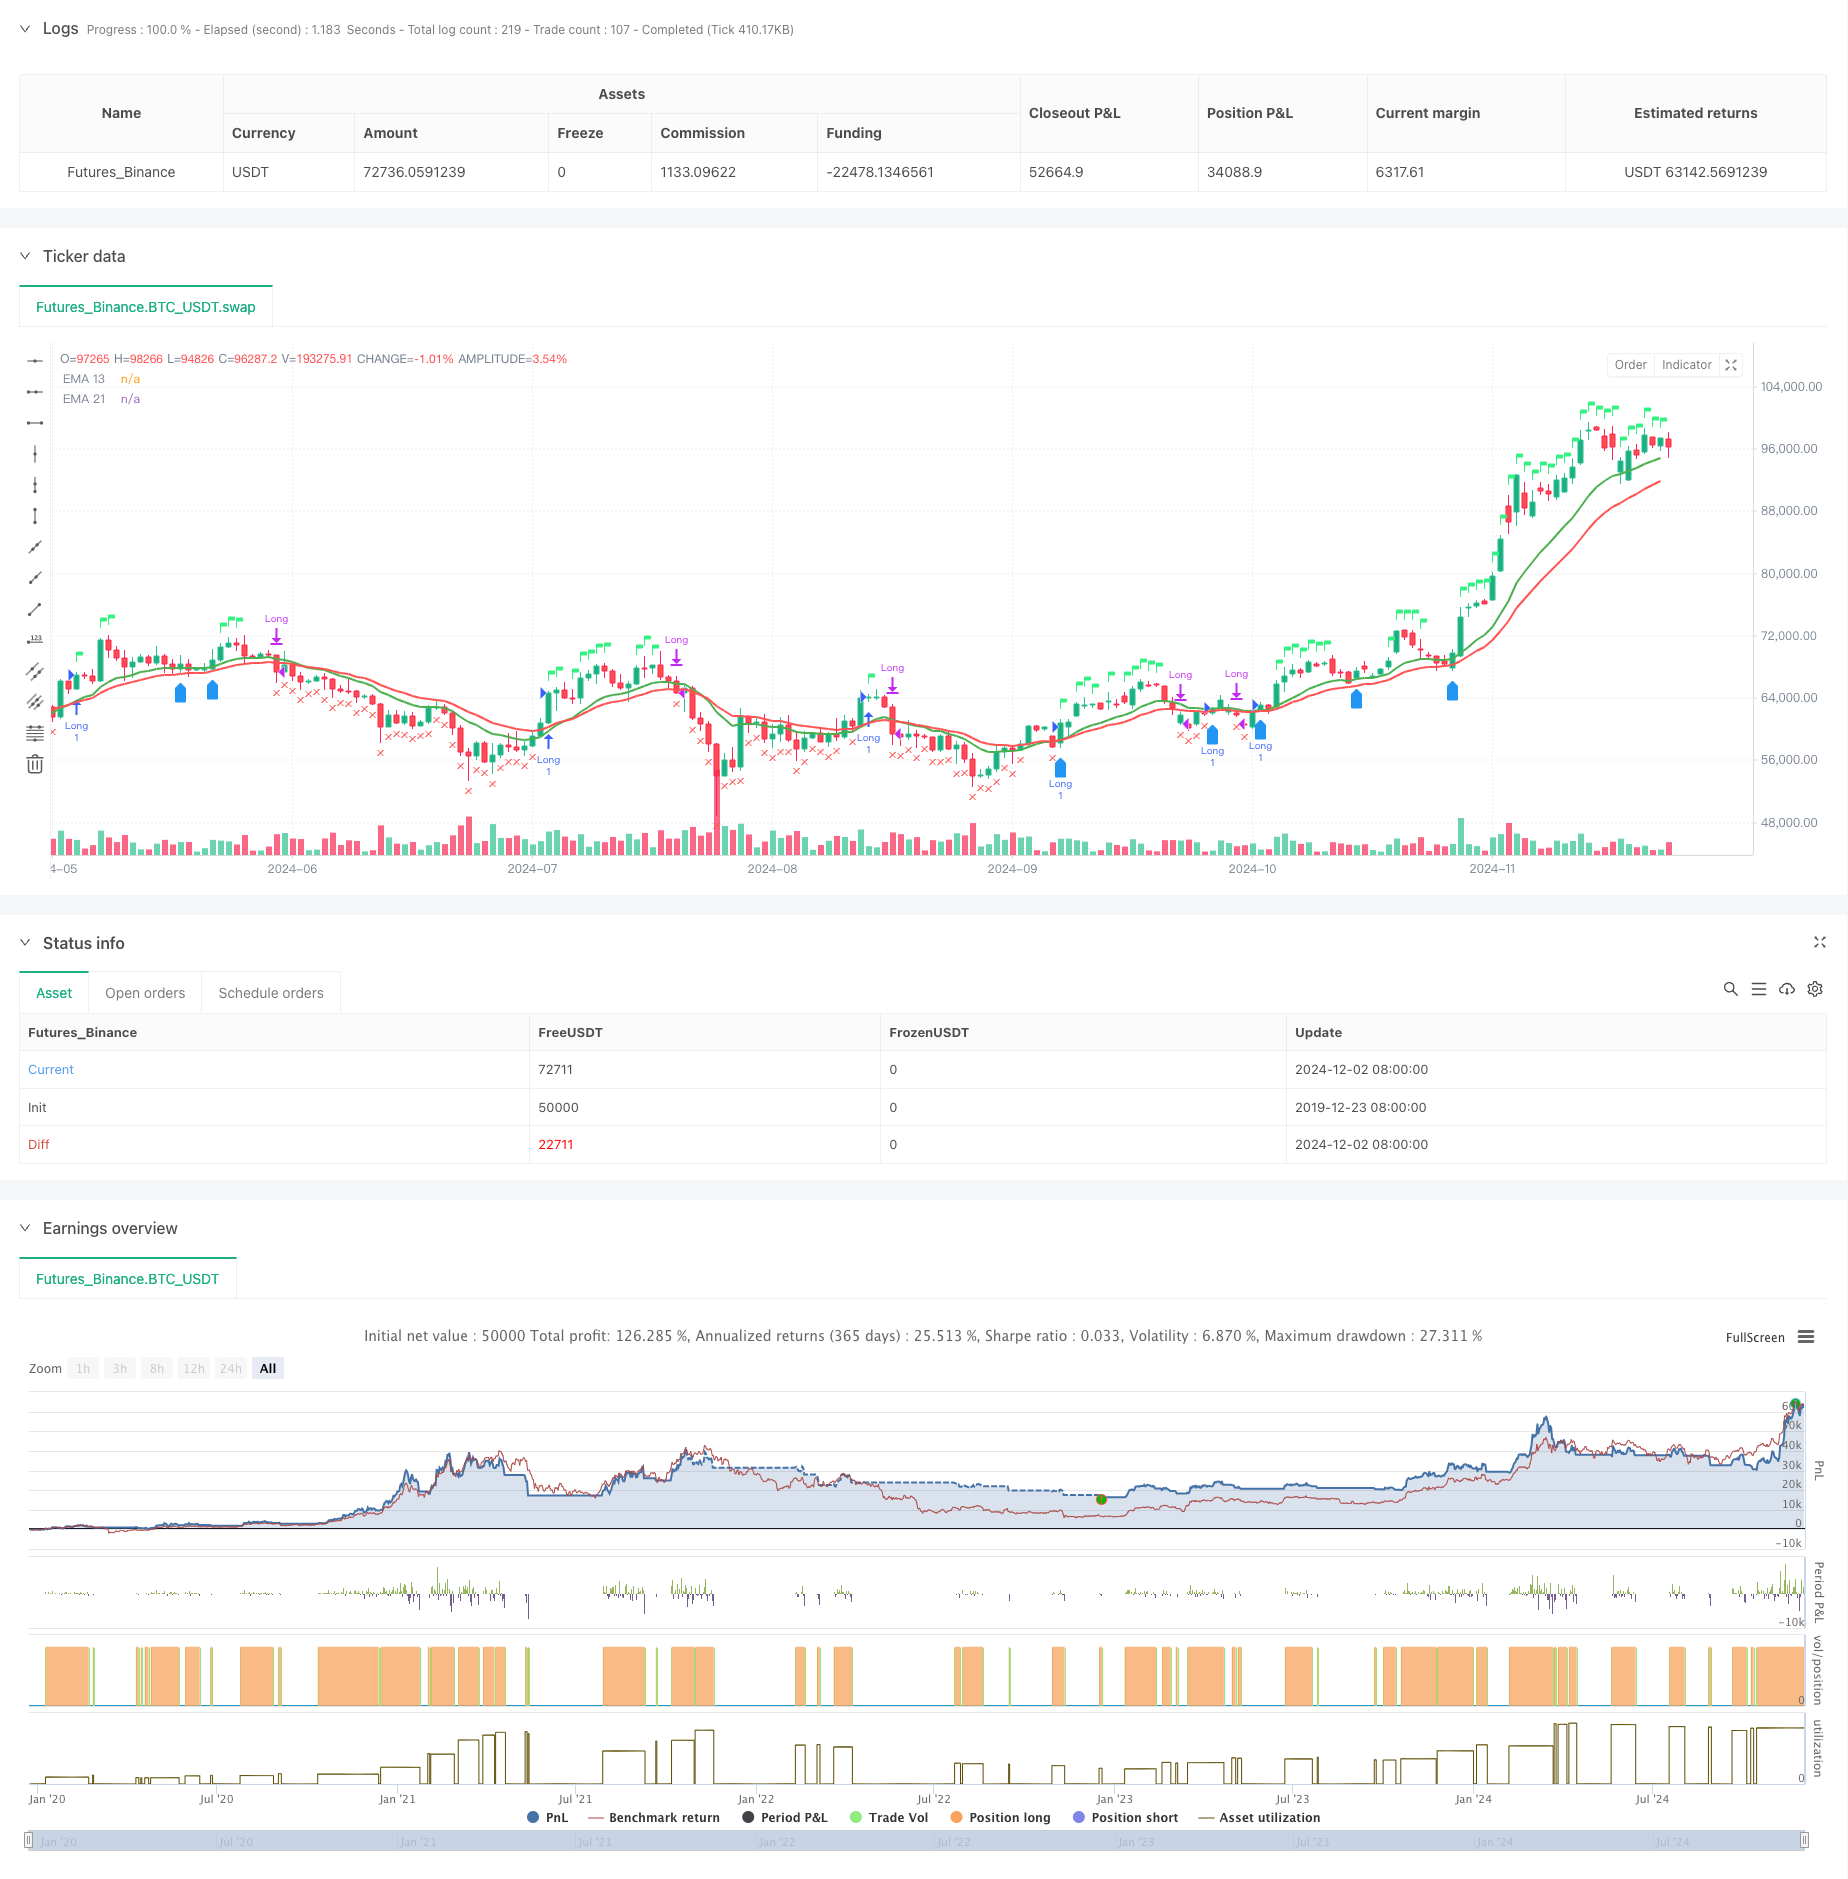
この戦略は,二重均線システム,相対的に弱い指標 ((RSI) と相対的な強さ ((RS) の分析を組み合わせた総合的な取引システムである. この戦略は,13日と21日の指数移動平均 ((EMA) の交差確認トレンドを介して,RSIとベースインデックスのRS値に相関して取引信号の確認を組み合わせて,多次元的な取引意思決定メカニズムを実現している. この戦略には,52週間の高点に基づくリスク制御メカニズムと再入場条件の判断も含まれている.
戦略原則
戦略は複数の信号の確認メカニズムを使用します.
- 入口信号は以下の条件を同時に満たす必要があります.
- EMA13上ではEMA21を着用するか,EMA13より高い価格
- RSIは60以上です
- 相対強度 ((RS) を正値とする
- 退出条件は以下の通りです.
- 価格がEMA21を下回った
- RSIは50未満でした.
- RSは負の値に変換されます.
- 再入学条件:
- 価格はEMA13でEMA13はEMA21より大きい
- RSは正の値に保たれています.
- 価格が先週の高値から 上がったり
戦略的優位性
- マルチシグナル認証メカニズムにより,偽侵入の危険性が低減
- 比較強度分析と組み合わせた強力な品種を有効に選択する
- 適応性のある時間周期調整メカニズム
- リスク管理システム
- スマートな再入学メカニズム
- リアルタイムで取引状況の可視化
戦略リスク
- 市場が揺れ動くと取引が頻発する可能性がある
- 複数の指標に依存すると,信号が遅れる可能性があります.
- 固定RSIの値は,すべての市場環境に対応しない可能性があります.
- 相対強度計算は,基準指数の正確さに依存する
- 52週間の高値のストップレスは緩やかすぎます.
戦略最適化の方向性
- 適応RSI値を導入する
- 再入学条件の判断論理を最適化する
- 取引量分析の次元を拡大する
- ストッププロフィットとストップロスの仕組みを改善する
- 波動率のフィルターに追加
- 相対強度計算サイクルを最適化
要約する
この戦略は,技術分析と相対強度分析を組み合わせて,包括的な取引システムを構築している.その複数の信号確認機構とリスク管理システムは,その強力な実用性を有している.提案された最適化方向によって,戦略はさらに向上する余地がある.戦略の成功実施には,トレーダーが市場について深い理解を持ち,特定の取引品種の特徴に応じて適切なパラメータ調整を行う必要がある.
ストラテジーソースコード
/*backtest
start: 2019-12-23 08:00:00
end: 2024-12-03 00:00:00
period: 1d
basePeriod: 1d
exchanges: [{"eid":"Futures_Binance","currency":"BTC_USDT"}]
*/

//@version=5
strategy("EMA 13 & 21 Entry Exit", overlay=true)

// Define the EMAs
ema13 = ta.ema(close, 13)
ema21 = ta.ema(close, 21)

// Define the RSI
rsi = ta.rsi(close, 14)

// Calculate the closing price relative to Nifty 50
//nifty50 = request.security("NSE:NIFTY", timeframe.period, close)
//closeRelative = close / nifty50

// Define a base period (e.g., 123) and adjust it based on the timeframe
//basePeriod = 123

// Calculate the effective period based on the timeframe
//effectivePeriod = basePeriod * (timeframe.isintraday ? (60 / timeframe.multiplier) : 1)

// Calculate the EMA
//rs = ta.ema(closeRelative, effectivePeriod)

// Define the Relative Strength with respect to NIFTY 50
nifty50 = request.security("swap", "D", close)
rs = ta.ema(close / nifty50, 55 )

// Define the previous 2-week low and last week's high
twoWeekLow = ta.lowest(low, 10)  // 10 trading days roughly equal to 2 weeks
lastWeekHigh = ta.highest(high, 5)  // 5 trading days roughly equal to 1 week
fiftytwoWeekhigh = ta.highest(high, 52*5) // 252 tradingdays roughly equal to 52 week.

// Long condition: EMA 21 crossing above EMA 55, price above EMA 21, RSI > 50, and RS > 0
longCondition = ta.crossover(ema13, ema21) or close > ema13 and rsi > 60 and rs > 0

// Exit condition: Price closing below EMA 55 or below the previous 2-week low
exitCondition = close < ema21 or rsi < 50 or rs < 0 //or close < fiftytwoWeekhigh*0.80

// Re-entry condition: Price crossing above EMA 21 after an exit, EMA 21 > EMA 55, and RS > 1
reEntryCondition = ta.crossover(close, ema13) and ema13 > ema21 and rs > 0

// Re-entry condition if trailing stop loss is hit: Price crossing above last week's high
reEntryAfterSL = ta.crossover(close, lastWeekHigh)

// Plot the EMAs
plot(ema13 ,color=color.green, title="EMA 13",linewidth = 2)
plot(ema21, color=color.red, title="EMA 21",linewidth = 2)


// Plot buy and sell signals
plotshape(series=longCondition, location=location.abovebar, color=color.rgb(50, 243, 130), style=shape.flag, title="Buy Signal")
plotshape(series=exitCondition, location=location.belowbar, color=color.red, style=shape.xcross, title="Sell Signal")
plotshape(series=reEntryCondition or reEntryAfterSL, location=location.belowbar, color=color.blue, style=shape.labelup, title="Re-entry Signal")
//plotshape(series = fiftytwoWeekhigh,location=location.abovebar, color=color.blue,style=shape.flag, title="52WH")

// Plot background color for RS > 0
//bgcolor(rs > 0 ? color.new(color.green, 90) : na, title="RS Positive Background")
// Plot the previous 2-week low and last week's high
// plot(twoWeekLow, color=color.orange, title="2-Week Low")
// plot(lastWeekHigh, color=color.purple, title="Last Week High")

// Strategy logic
if (longCondition or reEntryCondition or reEntryAfterSL)
    strategy.entry("Long", strategy.long)

if (exitCondition)
    strategy.close("Long")

 // Calculate Stop Loss (SL) and Profit
var float entryPrice = na
var float stopLoss = na
var float profit = na

if (strategy.opentrades > 0)
    entryPrice := strategy.opentrades.entry_price(strategy.opentrades - 1)
    stopLoss := fiftytwoWeekhigh * 0.80
    profit := (close - entryPrice) / entryPrice * 100

// Display the strategy table
var table strategyTable = table.new(position.top_right, 4, 2, border_width = 1)

// Make the table movable
tableX = input.int(0, title="Table X Position")
tableY = input.int(0, title="Table Y Position")

// Add size options for the table
tableSize = input.string("small", title="Table Size", options=["tiny", "small", "large"])

// Adjust table size based on user input
tableWidth = tableSize == "tiny" ? 2 : tableSize == "small" ? 4 : 6
tableHeight = tableSize == "tiny" ? 1 : tableSize == "small" ? 2 : 3

// Create the table with the specified size
//table = table.new(position.top_right, tableWidth, tableHeight, border_width = 1)

// Position the table based on user input
// table.cell(strategyTable, tableX, tableY, "Entry Price",  bgcolor=#18eef9)
// table.cell(strategyTable, tableX, tableY + 1, str.tostring(entryPrice, format.mintick), bgcolor=#18eef9)
// table.cell(strategyTable, tableX + 1, tableY, "Stop Loss (20%)", bgcolor=color.red)
// table.cell(strategyTable, tableX + 1, tableY + 1, str.tostring(stopLoss, format.mintick), bgcolor=color.red)
// table.cell(strategyTable, tableX + 2, tableY, "Profit (%)", bgcolor=color.green)
// table.cell(strategyTable, tableX + 2, tableY + 1, str.tostring(profit, format.percent), bgcolor=color.green)