1
フォロー
1750
フォロワー
概要
この戦略は,トレンドオフの価格振動指数 ((DPO) とインデックス移動平均 ((EMA) の交差に基づく定量取引戦略である.戦略の核心思想は,DPOと4周期EMAの関係を比較して市場傾向の変化を捉え,購入と売却のシグナルを生成することである.この戦略は,4時間以上の大規模な時間周期に特に適しており,平滑シフトグラフ ((Heikin Ashi) を使用するときにより効果的です.
戦略原則
戦略の中核となるロジックには、次の主要なステップが含まれます。
- 24周期単行移動平均 ((SMA) を基準線として計算
- SMAを前方へ移動して (length/2+1) 周期で,移動後のSMA値を得る.
- 閉盤価格を引いた移動後のSMAでDPO値を得る.
- DPOの4周期指数移動平均を計算する
- DPOが4サイクルEMAを突破すると,買入シグナルが生成されます.
- DPOの下の4サイクルEMAを突破すると,売り信号が生成される.
戦略的優位性
- 信号の明瞭性: 交差信号によって明確な買賣点が生み出され,主観的な判断を避けられる
- トレンド追跡効果:DPO指標は市場騒音を効率的にフィルターし,主要トレンドをよりよく捉える
- 遅延が少ない: 短周期 ((4サイクル) EMAを信号線として使用し,市場変化に迅速に対応できる
- 適応性:戦略は,異なる市場環境に対して一定の適応力を備えている.
- 操作の簡素性: 戦略の論理が明確で,理解し実行しやすい
戦略リスク
- 不安定な市場のリスク: 横ばいで不安定な市場では、誤ったシグナルが頻繁に発生する可能性があります。
- 遅滞リスク: 短期EMAを使用しても,一定の遅滞がある
- トレンド反転リスク:強気なトレンドが突然反転すると,大きな損失を招く可能性があります.
- パラメータ感度: 周期パラメータの選択に戦略効果が敏感である
- 市場条件依存性:戦略は特定の市場条件下では理想的でない可能性があります.
戦略最適化の方向性
- 波動率フィルタを導入:ATRまたは他の波動率指標を追加して,低波動率環境中の信号をフィルタリングできます.
- 増加傾向確認: ADXなどの他の傾向指標と組み合わせて,傾向の強さを確認する
- 最適化ストップ設定:市場の波動的動態に応じてストップポジションを調整できます
- シグナルフィルタリングの改善:偽信号をフィルタリングするために取引量確認または他の技術指標を追加
- パラメータ自在化: パラメータを動的に最適化して,異なる市場環境に対応する
要約する
DPO-EMAトレンドクロス戦略は,構造がシンプルですが,効果が顕著な量化取引戦略である.トレンドの振動指数と移動平均を組み合わせることで,この戦略は市場トレンドの変化を効果的に捉えることができる.いくつかの固有のリスクがあるものの,合理的な最適化とリスク管理措置によって,この戦略は,まだ実戦での優れた応用価値を持っています.
ストラテジーソースコード
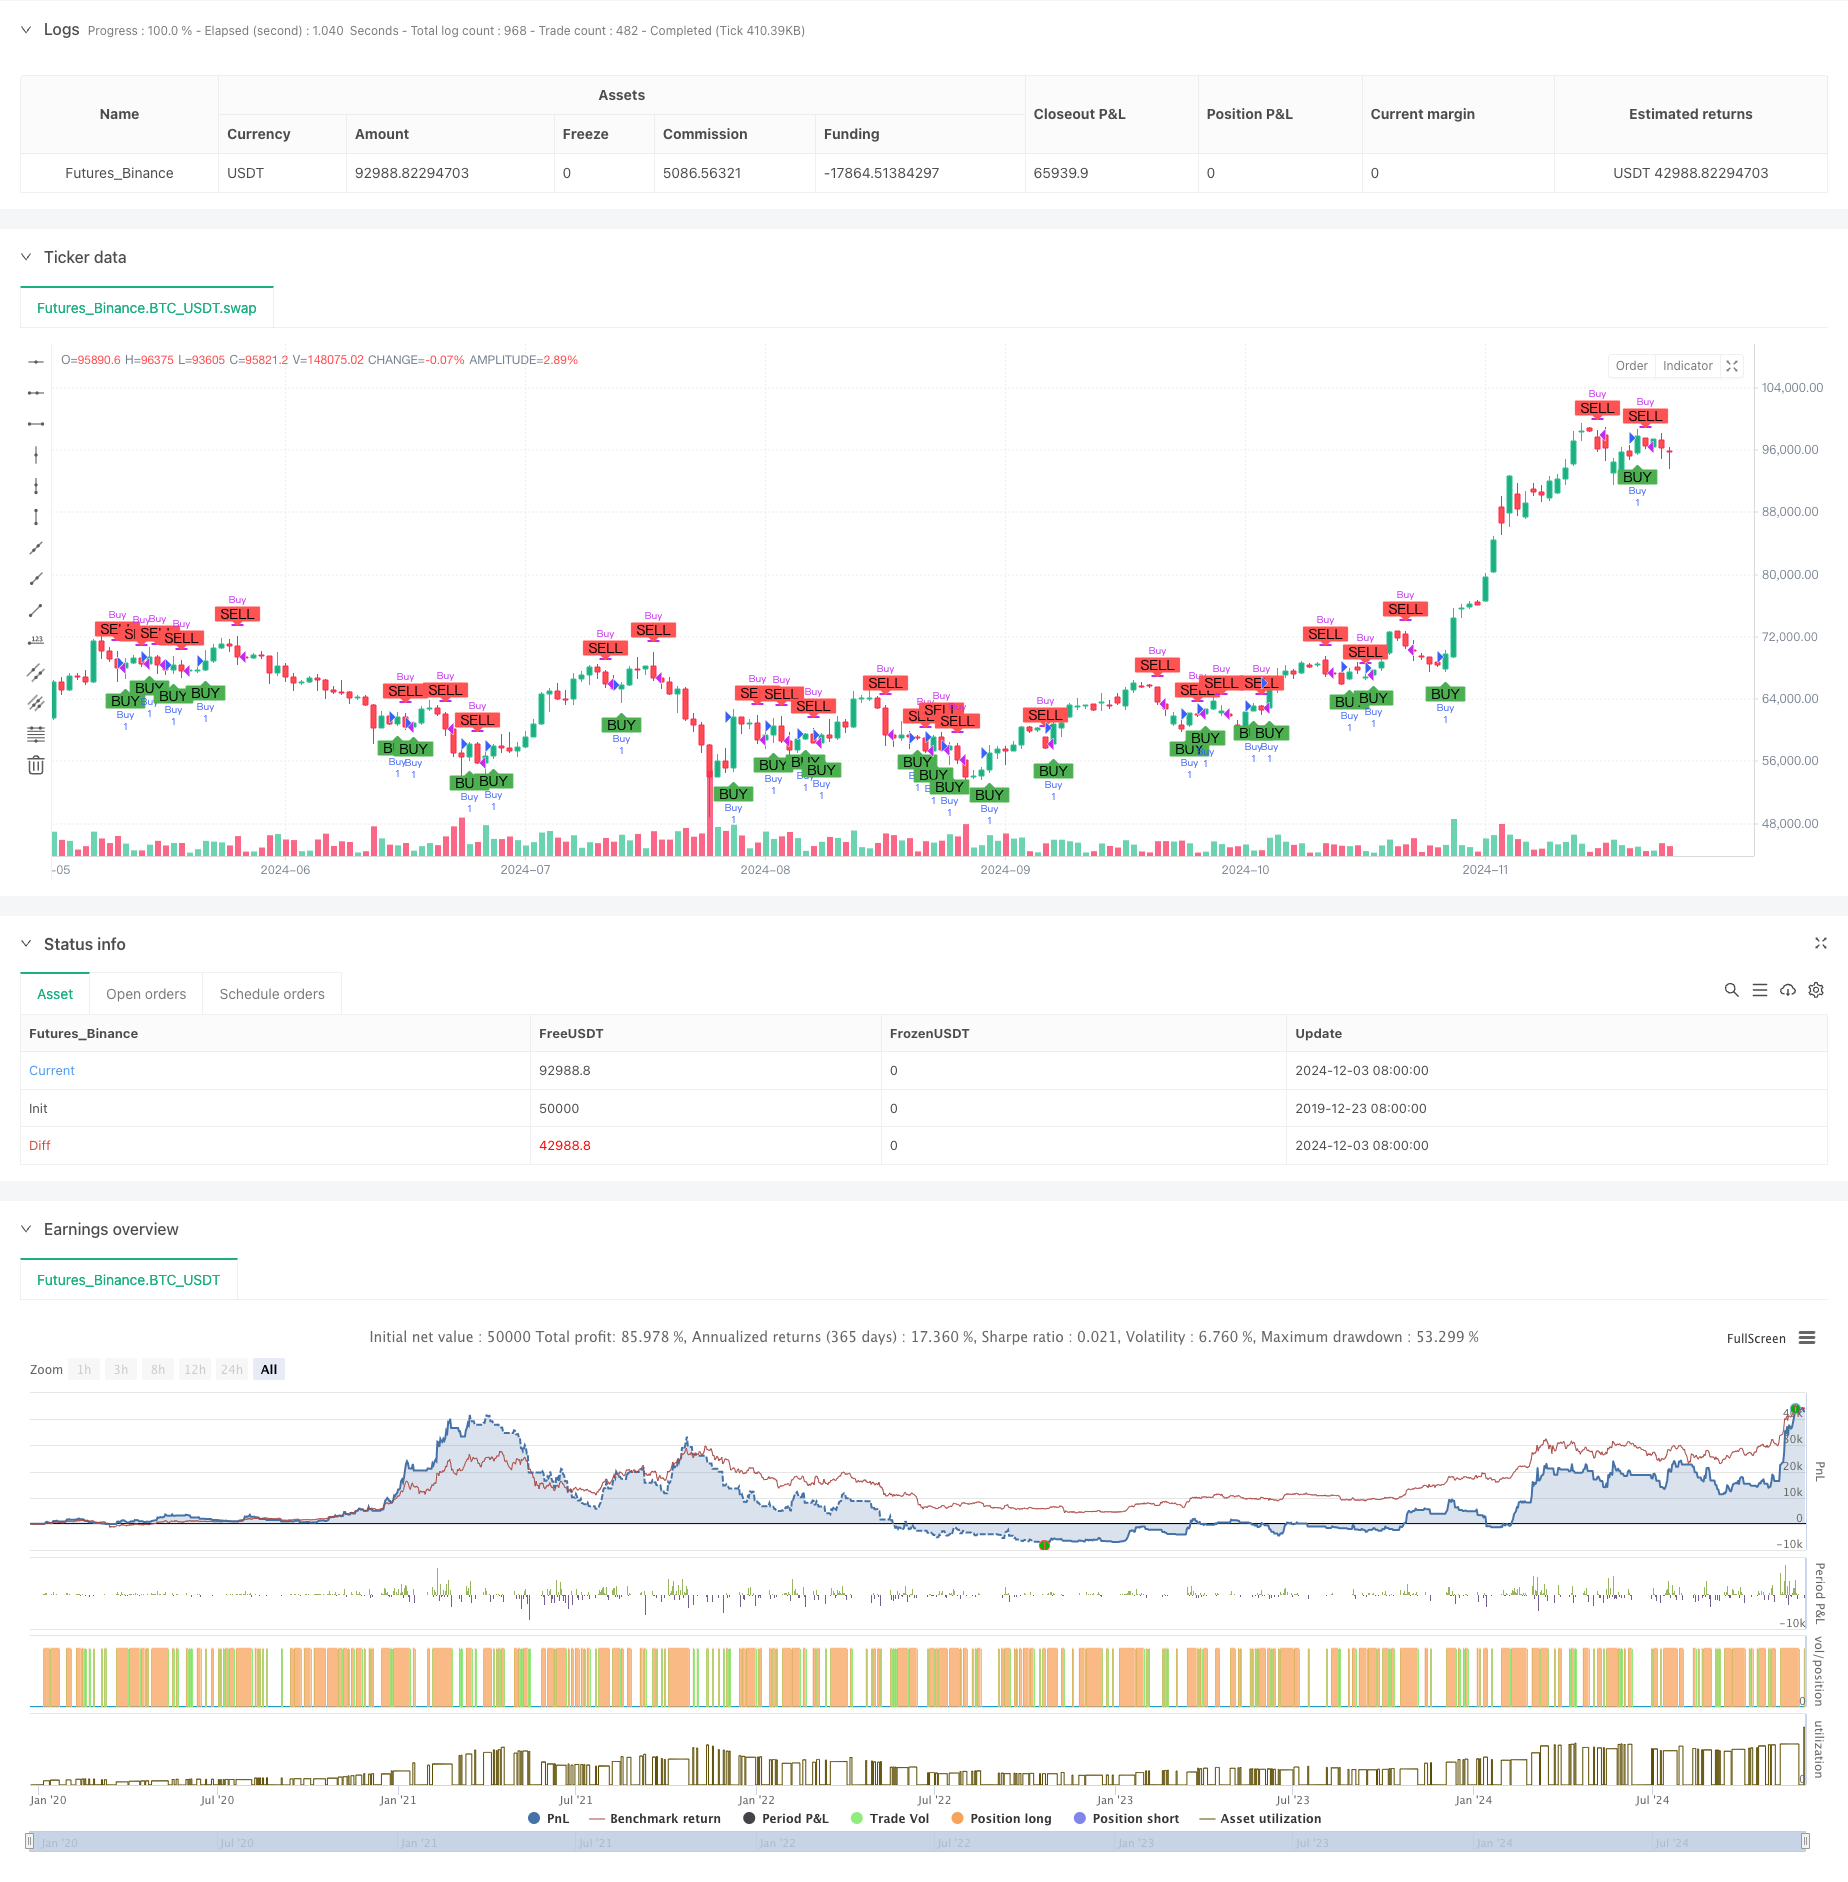
/*backtest
start: 2019-12-23 08:00:00
end: 2024-12-04 00:00:00
period: 1d
basePeriod: 1d
exchanges: [{"eid":"Futures_Binance","currency":"BTC_USDT"}]
*/

//@version=5
strategy("DPO 4,24 Strategy", shorttitle="DPO Strategy", overlay=true)

// Define a fixed lookback period and EMA length
length = 24
ema_length = 4

// Calculate the Simple Moving Average (SMA) of the closing prices
sma = ta.sma(close, length)

// Calculate the shifted SMA value
shifted_sma = sma[length / 2 + 1]

// Calculate the Detrended Price Oscillator (DPO)
dpo = close - shifted_sma

// Calculate the 4-period Exponential Moving Average (EMA) of the DPO
dpo_ema = ta.ema(dpo, ema_length)

// Generate buy and sell signals based on crossovers
buy_signal = ta.crossover(dpo, dpo_ema)
sell_signal = ta.crossunder(dpo, dpo_ema)

// Overlay buy and sell signals on the candlestick chart
plotshape(series=buy_signal, location=location.belowbar, color=color.green, style=shape.labelup, text="BUY")
plotshape(series=sell_signal, location=location.abovebar, color=color.red, style=shape.labeldown, text="SELL")

// Strategy entry and exit conditions
if (buy_signal)
    strategy.entry("Buy", strategy.long)

if (sell_signal)
    strategy.close("Buy")