RSIモメンタム戦略と組み合わせたトライアングルブレイクアウト

1
Follow
1781
Followers
概要
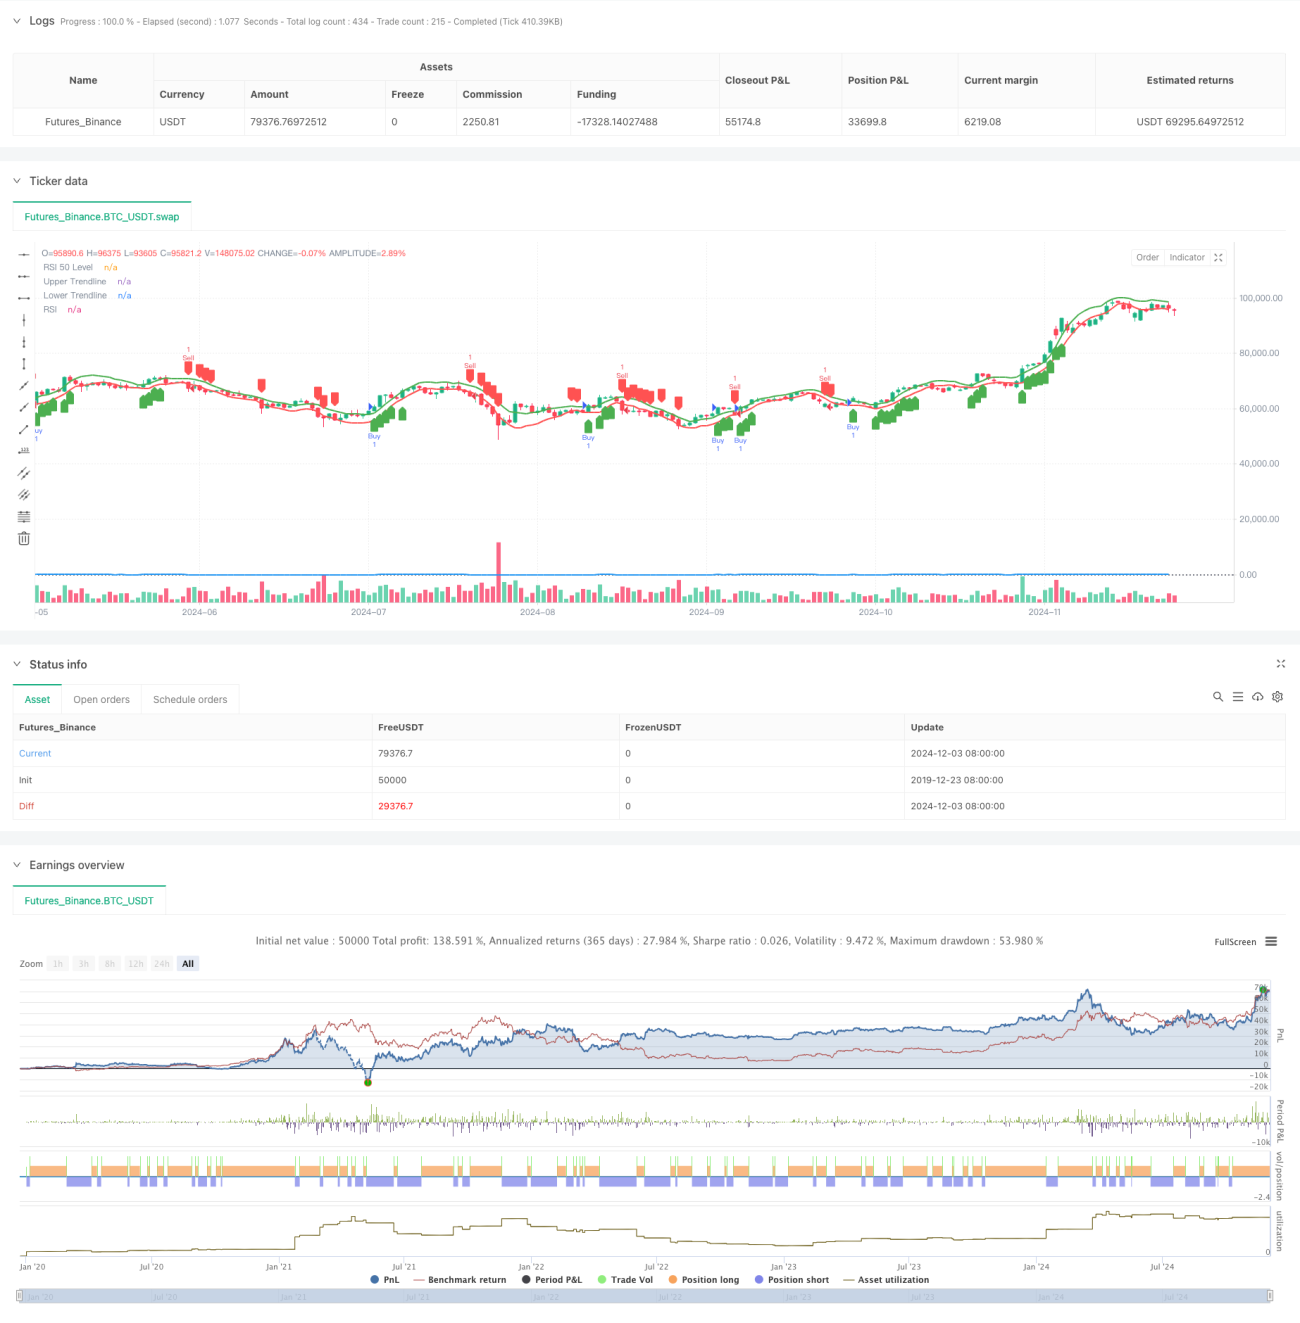
この戦略は,価格の形状と技術指標の組み合わせに基づいた定量取引システムである.これは,主に三角形状の突破を識別し,RSI指標の動力の確認と組み合わせて取引を行う.この戦略は,線形回帰方法を使用して,上下トレンドラインを構築し,価格の突破とRSIの位置から取引信号を決定し,形状分析と動力の分析の有機的な組み合わせを実現する.
戦略原則
戦略の核心的な論理には2つの主要な部分が含まれています. 三角形の形状認識とRSIの動態確認. まず,線形回帰法を使用して,最新のNサイクルの高点と低点を計算し,上下トレンドラインの三角形を形成します. 価格が上下トレンドラインを突破し,RSIが50を超えると,多信号を触発し,価格が下下トレンドラインを突破し,RSIが50未満になると,空信号を触発します.
戦略的優位性
- 構造の明快さ:戦略は形状分析と動態分析を有機的に組み合わせ,二重確認によって取引の信頼性を高めます.
- パラメタルの柔軟性: 調整可能な三角形長とRSI周期のパラメータを提供し,異なる市場特性を最適化します.
- 視覚化: 戦略の監視と反<unk>分析を容易にするために,トレンドラインと取引シグナルをグラフに明確に表示します.
- リスク管理:RSIをフィルターとして使用することで,偽突破のリスクを効果的に軽減できます.
戦略リスク
- 金融危機の状況では,取引の頻度が高くなり,取引コストが増加する可能性があります.
- トレンドラインの計算は歴史的なデータに基づいているので,急速な波動のある市場で遅れがある可能性があります.
- RSI指標は,特定の市場条件下で偽信号を生成する可能性があります.
- ストップ・ローズメカニズムが設定されていない戦略は,市場が激しく波動すると大きな損失を負う可能性があります.
戦略最適化の方向性
- ストップメカニズムの導入: リスク管理のために,固定ストップまたは移動ストップを追加することが推奨されます.
- エントリータイミングの最適化: 取引量確認の増やし,突破信号の信頼性の向上を検討できる.
- 信号フィルタリングの改善:トレンドフィルタを追加して横軸市場での頻繁に取引を避ける.
- 動態パラメータの最適化:市場変動率の動態に応じて三角形の長さとRSI<unk>値の調整を推奨する.
要約する
三角突破結合RSI動力の戦略は,構造が整った,論理が明確な量化取引システムである.形状と動力の二重確認機構によって,取引信号の信頼性が効果的に向上する.ある程度のリスクがあるが,合理的なパラメータ最適化とリスク管理措置によって,この戦略は良好な実用的な価値を持っている.現場で使用する時には,特定の市場の特徴に応じて十分なパラメータ最適化と裏付けを推奨する.
Source
Pine
Strategy parameters
Related strategies
Comment
All comments (0)
No data
- 1