複数期間の移動平均とRSIモメンタムクロスオーバートレンド追跡戦略

1
Follow
1781
Followers
概要
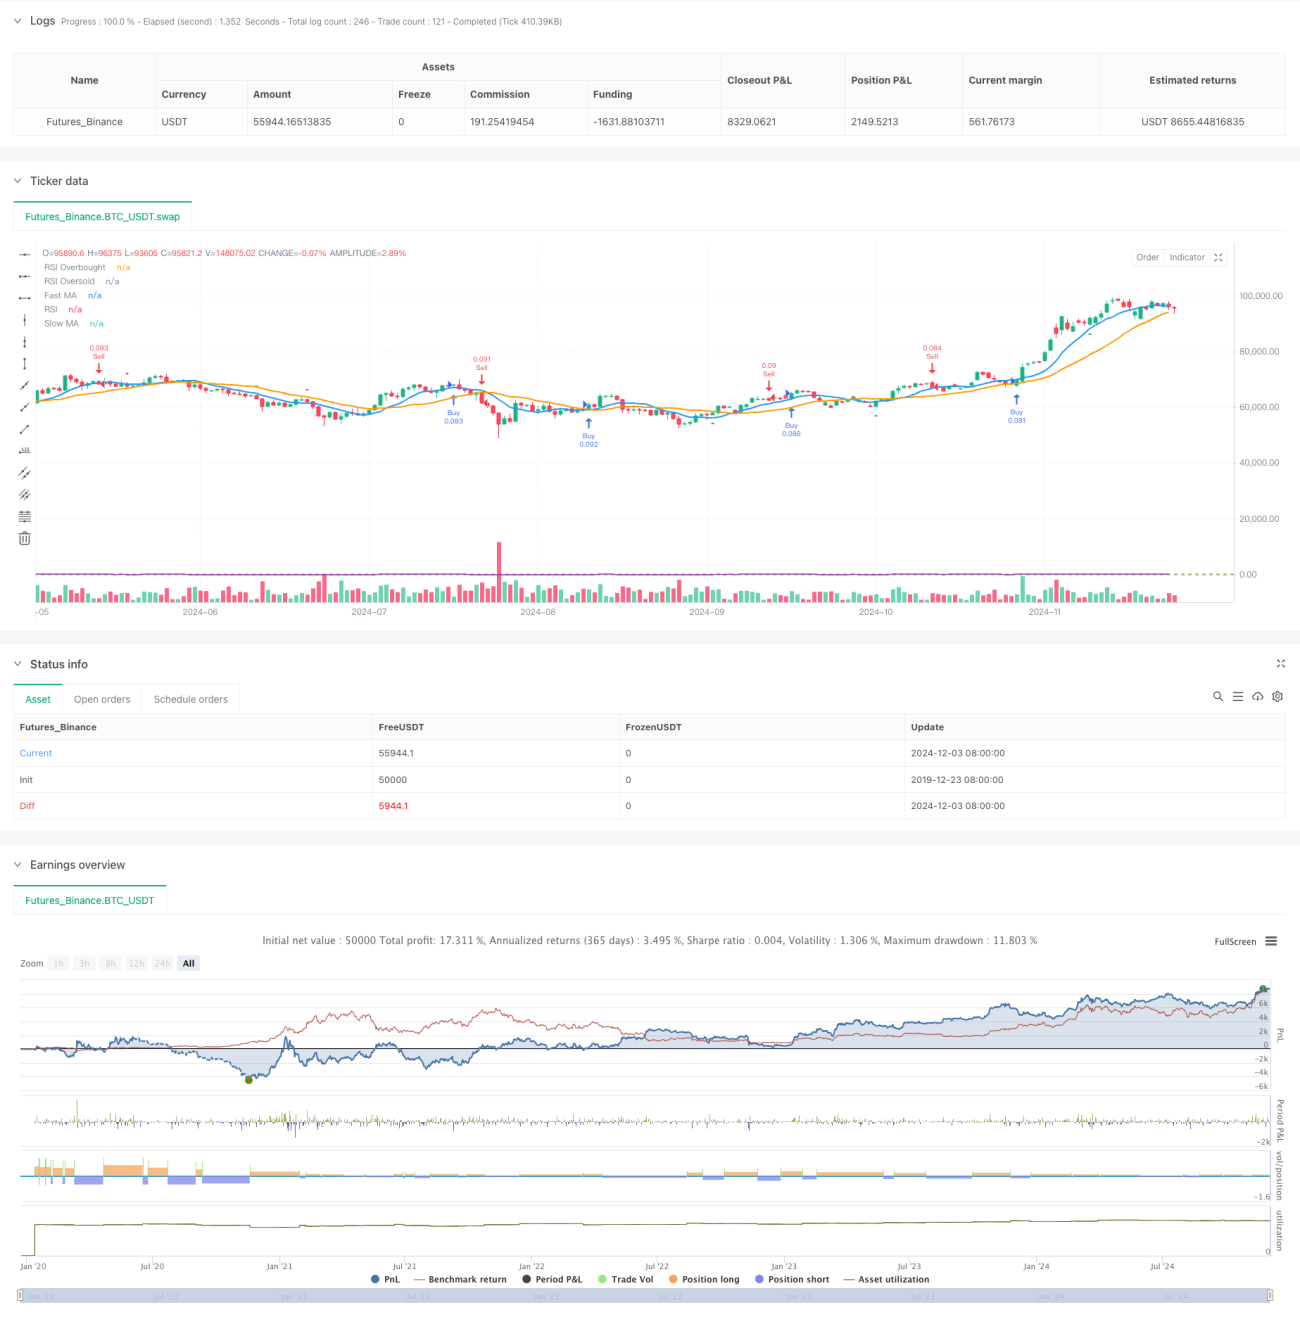
この戦略は,多周期移動平均,RSI超買超売シグナルと価格形態の識別を組み合わせた総合的な取引システムである.戦略は,主に,高速と遅い移動平均の交差,RSI指標の超買超売領域の判断,および看板,看板の浸食形態による市場のトレンドの転換点を捕捉して取引を生成する.この戦略は,パーセンテージポジションマネジメントを採用し,デフォルトで取引ごとに10%の口座資金を使用する.この方法は,より良いリスク管理を実現するのに役立ちます.
戦略原則
戦略の核心的な論理は,以下の重要な要素に基づいています.
- 移動平均システム: 9周期と21周期の単純な移動平均 ((SMA) を快速と遅速の平均線として使用し,平均線の交差によってトレンド方向を判断する.
- RSI動態指標: 14サイクルRSI指標を使用し,70を超買レベルと30を超売りレベルに設定し,価格動態を確認します.
- 価格形状識別: 補助的な取引シグナルとして,プログラム化された方法で看板と看板の吸収形状を識別する.
- シグナル総合:買入シグナルは,快線上での慢線を貫通し,RSIがオーバーセール区域にあるか,または看板の飲み込み形態が起こるのを満たす必要があります. 売り出せシグナルは,快線下での慢線を貫通し,RSIがオーバーバイエリアにあるか,または看板の飲み込み形態が起こるのを満たす必要があります.
戦略的優位性
- 多次元信号確認:技術指標と価格形態を組み合わせて,信号の信頼性を向上させる.
- リスク管理が完備:口座のパーセンテージホールディング方式を採用し,取引毎のリスクを効果的に管理する.
- トレンド追跡能力:平均線システムにより,中長期のトレンドを効果的に捉えることができる.
- シグナル可視化:戦略は,平均線,RSI指標,取引シグナルマークを含む明確なグラフィックインタフェースを提供します.
- フレキシブルなパラメータ設定:平均線周期,RSIパラメータなどの調整を可能にし,異なる市場環境に対応する.
戦略リスク
- 振動市場リスク:横盤振動市場では,頻繁に偽の突破信号が生じることがあります.
- 遅滞のリスク:移動平均は本質的に遅滞の指標であり,最高の入場時間を逃す可能性があります.
- パラメータの感受性:異なる市場環境において最適なパラメータには大きな違いがある可能性があります.
- 形状認識の正確性:プログラム化認識の形状は,実際の市場形状と偏差がある可能性があります.
戦略最適化の方向性
- 波動率フィルタを導入する:低波動率環境下での取引信号をフィルタリングするためにATR指標を追加することを推奨する.
- オプティマイズされたストップメカニズム:ATRベースの動的ストップを設定し,リスク管理の柔軟性を向上させる.
- 市場環境の判断を増やす:トレンドの強さの指標を導入し,異なる市場環境で異なるパラメータの組み合わせを使用する.
- ポジション管理の改善:シグナル強さや市場の変動率の動態に応じてポジションのサイズを調整できます.
- 加入時間フィルター:市場の時間特性を考慮し,特定の時間帯での取引を避ける.
要約する
これは合理的で論理的に明確な統合技術分析取引戦略である.複数の技術指標と価格形態を組み合わせることで,信号の信頼性を保証しながら,優れたリスク管理も実現する.いくつかの固有の限界があるが,推奨された最適化の方向によって,戦略の全体的なパフォーマンスはさらに向上する見込みがある.実際のアプリケーションでは,最適な取引効果を達成するために,パラメータの最適化と市場環境の適応に注意する必要があります.
Source
Pine
/*backtest
start: 2019-12-23 08:00:00
end: 2024-12-04 00:00:00
period: 1d
basePeriod: 1d
exchanges: [{"eid":"Futures_Binance","currency":"BTC_USDT"}]
*/

//@version=5
strategy("Comprehensive Trading Strategy", overlay=true, default_qty_type=strategy.percent_of_equity, default_qty_value=10)

// Input parameters for moving averagesStrategy parameters
Related strategies
Comment
All comments (0)
No data
- 1