EMAクロスオーバーモメンタムトレンドフォロー戦略

1
Follow
1781
Followers
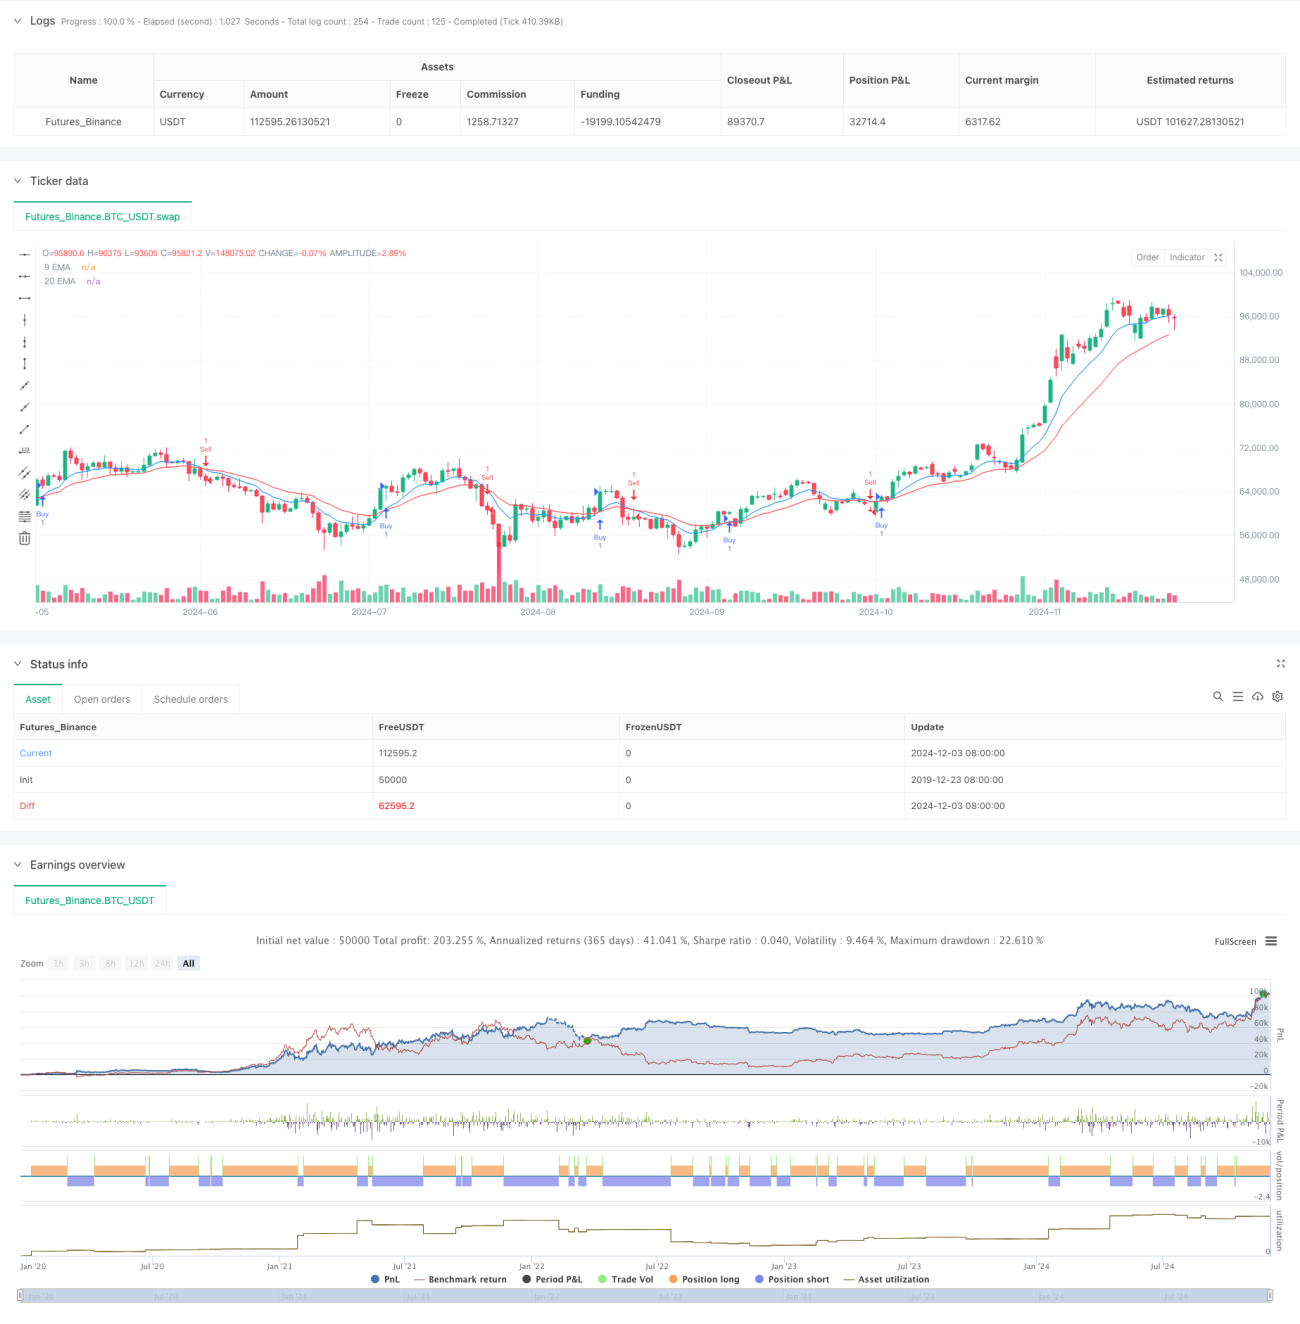
概要
この戦略は,9日と20日の指数移動平均 ((EMA)) の交差信号に基づくトレンド追跡取引システムである. 9日 (日) の急速なEMAと20日 (日) の遅いEMAの交差関係を監視することによって,市場トレンドの転換のタイミングを捉える. この戦略は,プログラム化された取引方法を採用し,完全に自動化され,人間の感情的な干渉を効果的に回避します.
戦略原則
戦略の核心は,2つの異なる周期の指数移動平均を使用してトレンドの方向と転換点を識別することです. 9日のEMAが20日のEMAを上方に通過すると,システムは複数信号を発信し, 9日のEMAが20日のEMAを下方に通過すると,システムは空信号を発信します. 指数移動平均は最新の価格に大きな重みを与え,価格の変化に迅速に反応し,トレンド転換のタイミングを把握するのに役立ちます.
戦略的優位性
- 操作規則は明確で,完全にプログラム的に実行され,感情的な干渉は避けられます.
- 指数の移動平均の計算方法を採用し,市場の変化に敏感である
- トレードリマインダー機能が設定され,トレーダーに通知されます.
- コード構造は明確で、保守や最適化が容易です。
- 異なる市場や時間帯に対応できる
- トレンド追跡能力が強い
戦略リスク
- 震動する都市では,頻繁に偽信号が発生する可能性があります.
- 入場時間は少し遅れるかもしれません.
- 停止や停止装置が設定されていません.
- 取引コストは考慮されていません.
- 市場が急激に波動する中で不況を招く可能性
- 資金管理に注意が必要です
戦略最適化の方向性
- リスク管理のための止損防止メカニズム
- 交差量指標を導入し,信号の信頼性を向上させる
- トレンドフィルターを追加し,波動の偽信号を減らす
- EMAパラメータを最適化して,戦略の適応性を向上させる
- 波動性指数への追加で取引のタイミングを最適化
- ポジション管理モジュールを設計し,収益リスク比率を向上させる
要約する
この戦略は,クラシックなトレンド追跡システムであり,EMAの交差によってトレンド転換の機会を捕捉する.戦略の論理はシンプルで明確で,理解しやすく,実行する.しかし,実際の取引では,他の技術指標と資金管理方法と組み合わせて,取引システムをさらに完善することをお勧めします.同時に,異なる市場特性に応じてパラメータを最適化することで,戦略の実用性を向上させることができます.
Source
Pine
Strategy parameters
Related strategies
Comment
All comments (0)
No data
- 1